Digital Marketing Glossary 2024

In the ever-evolving world of digital marketing, staying abreast of the terminology is crucial. This glossary serves as a comprehensive guide to understanding the key terms and concepts in digital marketing. Whether you’re a seasoned professional or a newcomer, this glossary will help you navigate the digital marketing landscape with ease.

Digital Marketing: Marketing using digital technologies and channels.

SEO and Content Marketing

  • SEO (Search Engine Optimisation): Optimising a website to rank higher in search engine results.
  • A/B Split Testing: Comparing two versions of a webpage or ad to see which performs better.
  • Backlink: An external link pointing to your website, valuable for SEO.
  • Blackhat SEO: Unethical SEO practices that violate search engine guidelines.
  • Content Categorisation: Organising web pages based on their purpose or content type.
  • Keyword: Search terms used by people to find information online.
  • Link Building: The process of getting other websites to link back to your site.
  • KPI (Key Performance Indicator): Metrics demonstrating marketing effectiveness.
  • Evergreen Content: Timeless, always relevant content like how-to guides
  • Title Tag: A brief, precise title for a web page, displayed in search engine results and browser tabs, crucial for SEO and user experience.
  • Meta Description: A concise summary of a web page’s content, shown under the title in search results, influencing click-through rates but not SEO rankings.
  • Meta Data: Information embedded in a web page’s HTML, providing search engines and browsers with details about the page’s content, purpose, and structure.
  • Featured Snippet: A search result box answering queries directly on the results page.

Website Optimisation

  • 301 Permanent Redirect: A server response indicating a URL has permanently moved to a new address. It automatically redirects the browser to this new location.
  • 404 Not Found: This status code appears when a server can’t find the requested page or file.
  • Breadcrumbs: Navigation aids showing the user’s path to their current page location.
  • Canonical Tag/Rel=Canonical: An HTML element specifying the preferred version of a web page to avoid duplicate content issues.
  • Nofollow/rel=”nofollow“: An attribute instructing search engines not to follow a link, thus not passing link equity, often used to avoid endorsing practices like link buying.
  • Core Web Vitals (CWV): Google’s set of metrics for evaluating a website’s user experience, including loading performance, interactivity, and visual stability.
  • CSS: Short for “Cascading Style Sheets,” it’s used for styling and laying out web pages.
  • HTML: Stands for “HyperText Markup Language,” the standard language for creating web pages.
  • HTTPS: An encrypted version of HTTP, ensuring secure communication over networks.
  • Landing Page: The first page a visitor lands on, often used in marketing campaigns to drive specific actions.
  • CRO (Conversion Rate Optimisation): Enhancing a website to increase the percentage of conversions.
  • Long-Tail Keywords: Specific, lower search volume keywords.
  • DR (Domain Rating): A metric for a website’s authority and ranking potential.
  • Broken Links: Non-functional links due to missing or error pages.

Social Media and Engagement

  • Engagement Rate: A metric showing the level of engagement (likes, shares, comments) relative to the number of followers or viewers.
  • Facebook Business Page: A public profile specifically created for businesses on Facebook.
  • Hashtag: A word or phrase preceded by a hash sign (#), used on social media for linking content to specific topics.
  • Instagram Advertising: Paying to display ads on the Instagram platform.

Advertising and Paid Media

  • Ad Extensions: Additional information under a Google Ad, like site links or pricing, enhances the ad’s visibility.
  • Ad Group: A collection of ads in a campaign targeting a shared set of keywords.
  • Bid Strategy: A Google Ads feature allowing advertisers to target specific campaign goals.
  • Ad Relevance: The degree of relatedness between keywords and ads, crucial in paid search.
  • CPA (Cost Per Acquisition): The cost incurred for each conversion or customer acquisition.
  • CPC (Cost Per Click): The cost an advertiser pays per individual click on their ads.
  • Facebook Advertising: Using Facebook’s platform to market products or services to its user base.
  • Google Ads: Google’s online advertising platform for reaching consumers through search and display networks.
  • Impression Share: The percentage of times an ad is shown out of the total eligible impressions in the market.
  • Bid Strategy: A Google Ads approach to align bidding with marketing goals, offering various payment options like per click, conversion, or impression.

Analytics and Performance Measurement

  • Bounce Rate: The percentage of visitors who leave a site after viewing only one page.
  • Conversion Rate: The percentage of visitors who take a desired action on a site.
  • Google Analytics: A tool for tracking website performance and user behaviour.
  • KPI (Key Performance Indicator): A measurable value that demonstrates how effectively a company achieves key business objectives.
  • Impression: The count of website or ad views.

Technical Aspects

  • Crawler: Software that browses the web to index content for search engines.
  • JavaScript: A programming language used to create interactive effects on web pages.
  • XML Sitemap: A file listing a website’s important pages, making it easier for search engines to crawl the site.

Miscellaneous

  • Cookies: Small data files stored on users’ devices to remember browsing activities and preferences.
  • E-E-A-T (Experience, Expertise, Authoritativeness, and Trustworthiness): Google’s criteria for assessing the credibility of web pages.

The Best Live Chat Software In 2024

Chatting directly to your potential customers while they are looking at your website is an ever growing trend. Being there to answer the queries they have… and giving a proactive and friendly portrayal of your business are just some of the reasons to install live chat software on your website

The Ultimate List of Search Engine Statistics for 2024

Search Engines are an incredibly useful way to navigate the web and that’s why they’ve been so integral to our online experience for several decades now.

If you’re old enough to remember life before search engines (like us!) then you’ll remember having to use manually curated website directories and, if you’re lucky, they were ordered into categories!

Slightly younger and you’ll probably remember asking Jeeves all your questions…

Today it’s almost impossible to go a day without using a search engine whether that’s for personal use or as part of your day job.

‘Googling’ is now a recognised word for searching the internet.

The impact of search engines has been far reaching and is also now a multi billion pound business with platforms such as Google Ads contributing the majority of Google’s revenue.

This has also led to many new private search engines popping up, such as DuckDuckGo, that commit to never storing any personal data like Google does and using it to show you targeted ads.

As Search Engine Optimisation experts, we’ve decided to curate the ultimate list of search engine statistics that you need to know about in 2024 to give you an overview of the state of play.

Some are to be expected, such as Google owning 92% of the search engine market worldwide, but some are surprising, some eye-opening and some unbelievable!

So whether you’re reading this for some statistics to use in your own article or presentation, for some insight when you’re planning your companies marketing strategy or just for some light reading, please feel free to share and quote this guide elsewhere.

*This article is regularly updated with the latest search engine stats, make sure to bookmark!

UK Search Engine Stats 

In this section we take a look at the state of the UK search engine share, what Brits are searching for, what devices they’re searching on and much more.

  • 86% of the UK search engine market share is held by Google, 10% Bing, 2% Yahoo! & 1% DuckDuckGo (Statista.com, 2021)
  • 60% of adults in the UK are searching for information, as well as using social networks, online banking, or reading news sites. (Host Reviews, 2019)
  • Google sites are most viewed and engaged with by UK audiences on mobile devices. (Host Reviews, 2019)
  • Google’s monthly audience in the UK in 2017 was reported as 41.9 million unique monthly visitors in the month of March alone. (Host Reviews, 2019)

“86% of the UK search engine market share is held by Google”

US Search Engine Stats

In this section we take a look at the US search engine market, buying habits amongst Americans and the competition to Google’s throne.

  • Google has a 88% market share in the US (Statcounter, 2021)
  • 63% of Google’s search engine visits in the US are on mobile (99 Firms, 2021)
  • Bing has a market share of 36.96% among US console users. (Backlinko, 2021)
  • 10% of Americans own a Google smart speaker (Fit Small Business, 2021)

“63% of Google’s search engine visits in the US are on mobile”

Global Search Engine Stats

Let’s take a look at how search engines rank worldwide, how other countries compare with the UK & US and some global trends to be aware of.

  • Nearly 93% of all web traffic comes through search engines. (99 Firms, 2021)
  • Google owns 92% of the search engine market worldwide (Statcounter, 2021)
  • Bing currently has a 2.71% share of the worldwide search engine market (Backlinko, 2021)
  • Globally, Google accounts for 76% and 86% of desktop and mobile search traffic, respectively. (99 Firms, 2021)

“Nearly 93% of all web traffic comes through search engines”

Google Stats

Everyone knows that Google is the daddy when it comes to search engines but how much of the share do they actually have and is this changing in recent years?

  • Google owns 92% of the search engine market worldwide (Statcounter, 2021)
  • Google processes around 70,000 search queries per second (99 Firms, 2021)
  • 5% of all searches have never been searched before on Google (99 Firms, 2021)
  • Google takes into account over 200 factors before delivering the best results to its users (99 Firms)

“Google processes around 70,000 search queries per second”


Bing Stats

It’s everyone’s 2nd favourite search engine but exactly how popular is Bing? How do Bing users behaviour differ to that of Google’s? And will they ever be able to compete with Google?

  • Bing gets more than 1 billion visits each month (Backlinko, 2021)
  • ‘Facebook’ is the most popular search term on Bing US, ‘Google’ is the most popular worldwide (Backlinko, 2021)
  • Visitors to the Bing website spend an average of 3 minutes 14 seconds on the site each day.  (Alexa, 2021)
  • Bing is ranked 35th in global internet engagement as of February 2021. In the US, Bing is ranked 15th. (Alexa, 2021)

“The most popular search term entered into Bing worldwide is ‘Google'”


Search Engine Marketing Stats

With all this website traffic, search engines have become big business. Search Engine Optimisation (SEO) & Pay per Click Advertising (PPC) have become huge industries. Find out some startling stats on search engine marketing below.

  • For every £1 that a business spends on Google Search and Ads, it makes £1 in profit. (99 Firms, 2021)
  • Microsoft generated $7.74 billion in search advertising revenue in the 2020 fiscal year. (Backlinko, 2021)
  • Amazon has 2x more product search volume than Google (Fit Small Business, 2021)
  • 81% of people search online for a product or service (Smart Insights, 2020)
  • Google Ads is Google’s biggest revenue stream and in 2020 it generated $104 billion making up 57% of Alphabet’s total revenue.

“81% of people search online for a product or service”


Sources

  • https://gs.statcounter.com/search-engine-market-share
  • https://www.statista.com/statistics/280269/market-share-held-by-search-engines-in-the-united-kingdom/
  • https://hostreviews.co.uk/google-statistics-uk/
  • https://99firms.com/blog/search-engine-statistics/
  • https://backlinko.com/bing-users
  • https://fitsmallbusiness.com/google-search-statistics/
  • https://www.smartinsights.com/search-engine-marketing/search-engine-statistics/
  • https://www.cnbc.com/2021/05/18/how-does-google-make-money-advertising-business-breakdown-.html

Our Favourite Digital PR & Content Marketing Campaigns Ever (2024 Update)

Digital PR is the practice of using online channels to generate awareness and positive publicity for a brand, product, or service. It can involve a variety of activities, such as building relationships with journalists and bloggers, creating and distributing newsworthy content, and managing social media campaigns.

In recent years, digital PR has become increasingly important, as more and more people are consuming news and information online. A well-executed digital PR campaign can help businesses to reach their target audiences, build trust and credibility, and generate leads and sales.

Here are some of the best digital PR campaigns from the last few years that have done exactly that and those that have struck a chord with us here in the office:

Saxton 4×4’s Electric SUV Study

Saxton 4×4, the UK’s largest 4×4 dealership, has executed a compelling digital PR campaign that delves into the growing market of electric SUVs. Utilising data from The International Energy Agency, the dealership has “crunched the numbers” to present an insightful narrative, complete with graphics, on the future of electric SUVs. The campaign not only educates the public about the future of electric SUVs but also positions Saxton 4×4 as a thought leader in the automotive industry. Its success in ranking for high-competition keywords demonstrates the efficacy of the campaign in capturing public interest and search engine visibility.

Tony’s Chocolonely, Oxfam, and Glastonbury

This PR campaign is a masterstroke. Oxfam partnered with Tony’s Chocolonely and Glastonbury to create a Charlie and the Chocolate Factory-inspired promotion. Limited edition chocolate bars containing Glastonbury tickets were sold, benefiting Oxfam. Tony’s, a rising UK brand, aimed to engage young, festival-hopeful consumers. The campaign drove footfall to Oxfam shops and sparked viral social media moments, from the hunt for bars to winners’ reactions.

Forza Finance’s Survey on Monthly Car Subscriptions

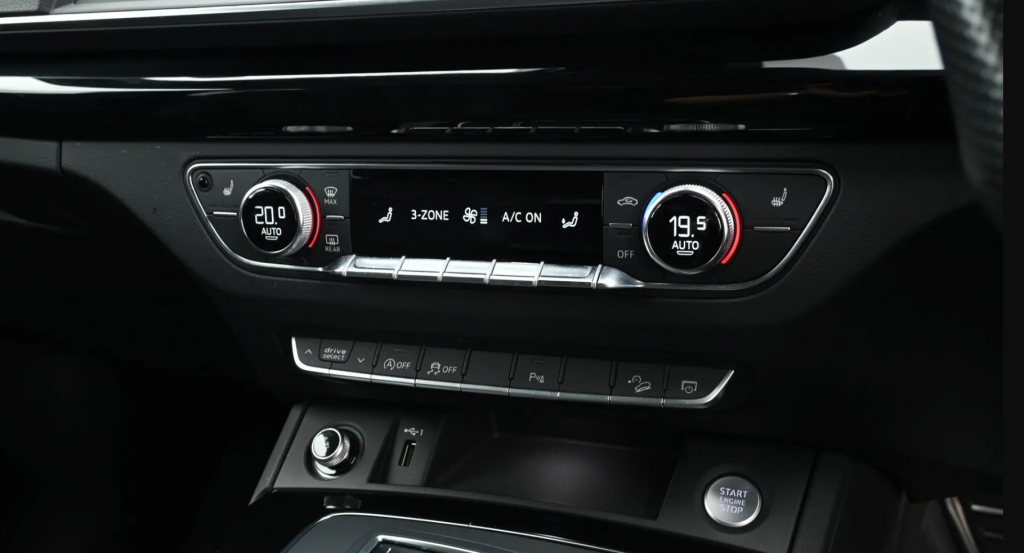
Forza Finance, specialists in luxury car finance, tapped into a controversial topic by conducting a survey on the public’s view of monthly subscription fees for car features. The survey revealed that a staggering 91% of British drivers believe such fees offer poor value. By choosing a subject that naturally sparks debate, Forza Finance demonstrated a savvy PR strategy, positioning themselves as a thought leader on contentious issues within the automotive finance industry.

Who Gives a Crap’s “Flush your ex” campaign

Who Gives a Crap is a toilet paper company that is known for its quirky and creative marketing campaigns. For Valentine’s Day 2023, Who Gives a Crap launched a campaign called “Flush your ex.” The campaign encouraged people to send their ex’s love letters to Who Gives a Crap, which would then be turned into toilet paper. The campaign was a huge success, and it helped to generate a lot of buzz and media attention for Who Gives a Crap.

WeBuyPrestigeCar’s Timely Guide on Fuel & Mileage Apps

WeBuyPrestigeCar capitalised on the topical issue of skyrocketing fuel prices by publishing an in-depth guide on the 12 best fuel price and mileage tracker apps. The guide offers a comprehensive list of apps that help drivers save money and time, making it highly relevant and useful for the audience. This strategic choice of topic has not only gathered numerous backlinks boosting the site’s SEO performance but also led to the blog post outperforming the homepage in terms of organic website traffic to this day.

Toolstation’s Engaging Study on the Great British Teabreak

Toolstation, a supplier of tools and hardware, brewed up a unique PR campaign focusing on the quintessentially British topic of tea breaks. The company surveyed both tradespeople and the general public to settle the debate on what makes the perfect cuppa. The campaign revealed that Yorkshire Tea is the UK’s favourite brand and that chocolate digestives are the go-to biscuit for most. The study has been well-received, gaining backlinks from reputable sites in the industry, making it a hot topic of discussion.

Cargiant’s Analysis on London Driving Test Pass Rates

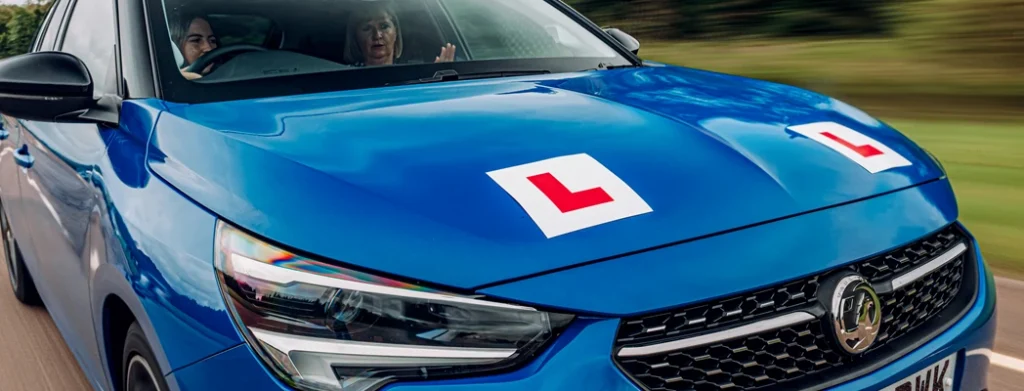
Cargiant, a prominent UK car dealership, has rolled out an insightful digital PR campaign focusing on driving test pass rates in London. The campaign, backed by data from gov.uk, offers a comprehensive analysis of pass rates across various test centres in London for the period April 2022 to March 2023. The campaign achieved coverage on many well known news websites including the International Business Times.

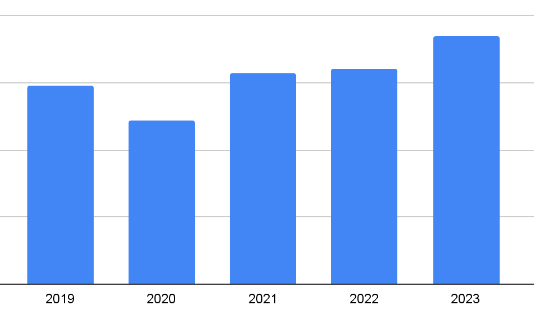
Skyscanner’s In-Depth Analysis on 2023 Travel Trends

Skyscanner, a leading travel search engine, released a comprehensive report on travel trends for 2023. The report highlights that price-driven travel will be a priority for the year, with 41% of consumers planning the same number of holidays as in 2022. It also reveals that 70% of UK travellers plan to spend the same or more on overseas travel. The study covers various aspects, from emerging destinations to the rise of digital nomadism.

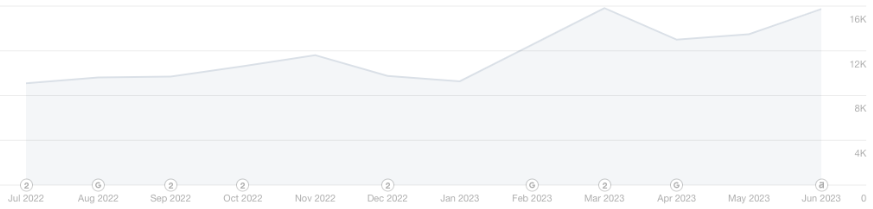
Makeover Centre’s Insightful Research on Pandemic-Driven DIY Trends

The Makeover Centre seized the moment during the pandemic to delve into the rising trend of home improvements. Their research indicated a significant uptick in Google searches for ‘Home Improvement’ and ‘DIY’ from January to July 2020, compared to the same period in 2019. The blog post has been particularly successful in attracting backlinks from reputable sites in the industry, enhancing its credibility and reach.

NHS Greater Glasgow and Clyde’s “Save a life, learn CPR” campaign

NHS Greater Glasgow and Clyde launched a campaign called “Save a life, learn CPR” in an effort to raise awareness of the importance of learning CPR. The campaign involved a series of videos and social media posts that explained how to perform CPR and highlighted the importance of knowing how to do so. The campaign was a huge success, and it helped to increase the number of people who signed up for CPR training.

Mindshare UK and Legal & General’s “Moving House Stress Signals” campaign

Mindshare UK and Legal & General partnered to create a campaign called “Moving House Stress Signals.” The campaign involved a survey of over 2,000 people to identify the most common signs of stress experienced by people who are moving house. The campaign generated a lot of media coverage and social media engagement, and it helped to raise awareness of the importance of managing stress during a house move.

EasyFit Garage Doors’ Analysis on UK Home Burglaries

With a drop in the number of burglaries during the pandemic, EasyFit Garage Doors wanted to ensure home security isn’t taken for granted now we are out the other side. Their research showed that a lot of UK homeowners don’t have the basic security in place, leaving their garage unlocked, despite this being in the top 5 entryways that criminals will use to enter the home. The campaign sparked awareness for tougher home security and the alarming stats were shared by reputable home improvement sites within the same industry.

PPC Management Campaign Case Study – Forza Finance

In today’s digital marketing landscape, Pay-Per-Click (PPC) advertising plays a crucial role in driving traffic, increasing visibility, and accelerating conversions. This case study encapsulates the transformative two-year journey of Forza Finance, a prominent player in the car finance industry, during a strategic PPC campaign.

Background

Forza Finance had a clear mission in mind: over the course of two years, they wanted to ramp up their Google Ads reach. The mission wasn’t just about scaling up, so we made sure every pound spent was worth it. The goal was to optimise the campaign to the highest degree, striving to keep the cost per lead as low as possible.

Strategy

Armed with best practices gleaned from our extensive experience in the automotive PPC market, we embarked on a mission to transform Forza Finance’s PPC performance. Key strategic interventions included:

Implementation of Effective Programmatic Bidding: We leveraged programmatic bidding techniques to maximise ad impact and reach the most suitable audience segments.

Granular Campaign/Account Structure: We adopted a granular approach to campaign and account structuring, enabling more precise targeting and better management of ad placements.

Optimisation of Landing Pages and Customer Journey: We improved user experience by optimising landing pages and streamlining the customer journey, enhancing the likelihood of conversions.

Continual A/B Testing and Optimisation: We implemented ongoing A/B testing of ad variants and optimised ad copy to improve ad performance and engagement.

Custom Audiences and Segmentation: We created custom audience segments to deliver more personalised and effective ads.

Leveraging New Google Ads Features: We quickly adapted and optimised newer Google Ads features such as Performance Max to stay ahead in the dynamic PPC landscape.

Results

Over the two-year period, the PPC campaign significantly boosted Forza Finance’s digital performance:

Conversions: We observed a whopping 460% increase in conversions.

Cost per Conversion: Cost per conversion was reduced by 37%, demonstrating improved cost-efficiency.

Conversion Rate: Conversion rate improved from 3% to 10%, indicating enhanced effectiveness of the ad campaigns.

Click-Through Rate (CTR): CTR jumped from 1% to a remarkable 11%.

Conclusion

The last two years stand as a testament to the power of strategic and consistent efforts. Through the implementation of industry best practices and innovative strategies, we managed to substantially increase conversions while reducing the cost per conversion, maximising Forza Finance’s return on investment.

The journey with Forza Finance doesn’t end here. We remain committed to innovating, testing, and optimising our strategies to ensure that the company continues to outperform in the dynamic and challenging PPC landscape.

Stay tuned for another update on the project in 6-12 months time but in the meantime why not check out our other case studies or our Digital Marketing for the Automotive Industry page with more specific details on how we can help your business.

Full SEO Management Case Study – Saxton 4×4

In the digital epoch we live in, robust online presence holds paramount importance across all business sectors, and the automotive industry is no exception. This case study outlines the success story of Saxton 4×4, a leading UK 4×4 dealership, during a strategic two-year SEO management campaign that commenced in 2021.

Background

Despite the impressive standing in the car sales industry, Saxton 4×4 encountered external challenges in 2022 due to worldwide issues, such as chip shortages, which impacted negatively across the automotive sector. However, Saxton 4×4 not only sustained their sales targets, but also expanded its organic traffic from 2021 to 2022, despite the market being up and down. Recognising the need to further bolster online visibility and brace for future uncertainties, we worked to create a comprehensive and robust SEO strategy.

The Strategy

Our journey began in 2021 with an exhaustive technical audit of Saxton 4×4’s existing website. In collaboration with web developers, we optimised all technical SEO aspects based on the audit insights, which charted the path for the subsequent technical enhancements.

To broaden organic reach, we gave the site content a complete makeover, ensuring it was SEO-friendly, pertinent, and engaging for users. We strategically restructured the landing pages to incorporate keyword-optimised content, intuitive navigation, and lucid call-to-actions, enhancing user experience and interaction.

Simultaneously, we introduced regular blog posts and thought-leading content that not only offered value to users but also uplifted the site’s authority. Furthermore, we launched crucial link-building campaigns to improve domain authority and overall website ranking.

Recognising the immense potential of digital PR and influencer marketing, we tapped into these avenues to extend the brand’s footprint. Engaging prominent automotive influencers through meticulously curated campaigns, we generated significant buzz around the brand and bolstered its market standing.

Outcomes

The outcomes of our two-year SEO management campaign, from 2021 to 2023, were nothing short of remarkable, significantly augmenting Saxton 4×4’s digital performance.

Keyword Ranking: We recorded 270 new ranking keywords out of 336 tracked, denoting a notable improvement in the brand’s visibility on search engines.

Page Position: There was a significant rise in the number of first-page keywords by 132, leading to a substantial increase in organic traffic. Moreover, the top 5 position keywords witnessed a leap by 52.

Organic Users: Despite the adversities in 2022, we achieved a striking 65% growth in organic users over the two-year period, underlining the effectiveness of our strategies.

Conclusion

The two-year campaign with Saxton 4×4, that began in 2021, stands as a strong testament to the power of SEO when underpinned by strategic planning and consistent execution. From a comprehensive technical overhaul to a thorough content rework, we successfully reshaped Saxton 4×4’s digital landscape, paving the way for sustained growth.

The impressive results underscore the potency of our approach, enhancing visibility, fostering user engagement, and driving more traffic even amidst challenging market conditions. This journey with Saxton 4×4 doesn’t conclude here; we remain steadfast in our commitment to continuously innovate, optimise, and adapt our strategies to ensure the brand stays at the forefront of the ever-changing digital landscape of the automotive industry.

Stay tuned for another update on the project in 6-12 months time but in the meantime why not check out our other case studies or our Digital Marketing for the Automotive Industry page with more specific details on how we can help your business.

Handy GA4 Migration Checklist

Leveraging the advanced machine learning capabilities of Google Analytics 4 can significantly enhance your decision-making process and accurately quantify impact. As of July 1, 2023, Universal Analytics properties will no longer process new data. This necessitates the adoption of Google Analytics 4 as your primary platform for analytics immediately to prevent data loss and potential decline in campaign performance. Here is a handy checklist to ensure you migrate successfully.

If you require help setting up your GA4 property, get in touch with our expert team at [email protected].

1. Setup and link Google Analytics 4 property

Time to completion: 30-60 min

2. Core feature configuration

Time to completion: 1-2hrs

3. Use Google Analytics 4 as primary Analytics platform*

Time to completion: 2 weeks*

The Ultimate List of UK Startup & Small Business Statistics

*This has been updated for 2023

There’s no doubt that starting a business is one of the most daunting things you can do, not only in your professional career but in your life as a whole!

Most entrepreneurs will be giving up a steady, well paying job to roll the dice and start from scratch as the owner of their own, brand new business.

From huge decisions such as choosing your product or service, target audience and how to raise funds, to more frivolous choices such as which shade of blue your logo will be, there’s plenty to think about!

If you’re reading this article then you’ve probably already seen numerous startup failure rate statistics that so often get shared across national news sites and social media.

However, there’s a whole bunch of positive startup stats too which paint an altogether more rosy picture of becoming your own boss.

Statistics and analysis can also be a great way of understanding the current state of the UK startup scene and identifying potential pitfalls or areas of opportunity.

It’s for all these reasons that we’ve produced this ultimate list of startup statistics for you to cast your eye over and gain insight from.

Reasons for Starting Up 

In this section we take a look at the most common reasons that UK entrepreneurs start their own business, what inspires them to do so as well as what holds people back.

  • 64% of UK workers wants to set up a business (SME Loans, 2019)
  • 83% of 18-24 year olds have ambitions of self-employment (SME Loans, 2019)
  • More males (69%) have ambitions to start up than women (56.4%) (SME Loans, 2019)
  • Over ⅓ of the UK workforce don’t enjoy their job (SME Loans, 2019)
  • The age group most driven by financial gain are 18-24 year olds (SME Loans, 2019)
  • 1 in 3  UK workers want flexible working hours and have the option to work from home (SME Loans, 2019)
  • 43% of aspiring entrepreneurs don’t think they will ever set up their company (SME Loans, 2019)
  • ¼ of aspiring UK entrepreneurs are put off by ‘fear of stress’ (SME Loans, 2019)
  • ⅓ of aspiring UK entrepreneurs would like to set up business with their husband or wife
  • Only 13% of UK workers would choose their best friend as a business partner
  • 39% of young entrepreneurs saw lack of access to funding as a major barrier to growth (Institute of Directors, 2016)

“⅓ of aspiring UK entrepreneurs would like to set up business with their husband or wife”

Startup Failure Stats 

Startup failure statistics are the most shared startup stats online. Take a look at some of the damning startup failure statistics below which shows just how hard it can be going alone.

  • Fewer than half of UK Startups make it beyond 5 years (GOV.UK, 2019)
  • 60 % of new businesses will go-under within three years (Telegraph, 2019)
  • 20% of new businesses will close their doors within just 12 months (Telegraph, 2019)
  • Nearly 1 in 5 new businesses fail in the UK each year (Buisness4Beginners, 2023) 
  • Between 2020 and 2021, 390,000 businesses failed (money, 2023) 

“20% of new businesses will close their doors within just 12 months”

Startup Success Stats 

Don’t believe all the negative headlines. There’s more than enough small business success stats to reveal that UK businesses are still thriving.

  • 1 company is formed every minute in the UK (GOV.UK, 2019)
  • 89% of UK startups survive their first year (ONS, 2019)
  • There were 5.8 million small businesses at the start of 2019, up from 5.7 million in 2018 (despite Brexit concerns) and up from 5.5 million in 2017. (GOV.UK, 2019)
  • The number of small businesses in the UK has increased every year since the year 2000 and is expected to do so throughout the ‘20’s’. (GOV.UK, 2019)
  • Before the pandemic, nearly eight out of ten SMEs reported that they were making a profit each year (money, 2023) 

“1 company is formed every minute in the UK”

Startup Funding Stats 

Startup funding or ‘capital’ is the money required to get a new company on its feet and turn an idea into a business. Startup funding can come from a variety of avenues such as personal savings, friends & family, loans, crowd funding and more.

  • 2017 was a record high year for UK startup funding (Beauhurst, 2019)
  • The total invested in UK startup companies dropped 15pc from £8.27 billion to £7 billion in 2018 amid Brexit fears (Beauhurst, 2019)
  • 82% of Startups used Self Funding to start their business (Institute of Directors, 2016)
  • 56% of Startups use self funding as their only source (Institute of Directors, 2016)
  • 74% of startups used just one source of funding to start their business (Institute of Directors, 2016)
  • On average, $10,000 are borrowed when starting up (moneyzine, 2023)

“74% of startups used just one source of funding to start their business”


Startup Stats By Sector 

Startup statistics differ greatly by sector and it’s important to seek out industry specific figures when making predictions or forecasts. 

  • 99.9% of all private sector businesses in the UK are SMEs (GOV.UK, 2019)
  • 69% of service based businesses have a startup budget below £5,000 (Institute of Directors, 2016)
  • 67% of creative businesses have a startup budget below £5,000 (Institute of Directors, 2016)
  • 75% of recruitment companies have a startup budget over £10,000 (Institute of Directors, 2016)
  • 75% of finance businesses have a startup budget over £10,000 (Institute of Directors, 2016)
  • In the private sector, SMEs account for 61% of employment (startups, 2022)

“99.9% of all private sector businesses in the UK are SMEs”

Startup Stats By Location 

Startup stats that focus on location tell a very interesting story about the current state of funding, entrepreneurship and wealth across different areas of the UK. As you’d expect, London is the home of the startup but is that changing?

  • London is above the national average for businesses, 1,563 businesses for every 10,000 adult residents (GOV.UK, 2019)
  • In the UK, there are 1,059 businesses per 10,000 residents (GOV.UK, 2019)
  • London (1.1 million) and the South East (940,000) had the most private sector businesses, accounting for 35% of the UK business population (GOV.UK, 2019)
  • The North East had the lowest private sector businesses of any English region with just 152,000 (GOV.UK, 2019)
  • One in three businesses are in London or the South East. (GOV.UK, 2019)

“One in three businesses are in London or the South East”

Owner Profile 

What does the standard small business owner in the UK look like and how does this differ to the rest of the world? Startup owner profile stats can highlight notable trends on age, race, gender, education and more.

  • The majority of UK entrepreneurs are in their 40’s (Startups)
  • Only 14% of UK SMEs are woman-led (Startups)
  • Just 11% of Startup owners have no educational qualifications (Startups)
  • Only 8% of UK small business employers are MEG-led; that is led by a member of a minority ethnic group (Startups)
  • Small businesses in London are more likely to be minority ethnic group-led, at 22%, compared to 8% overall. (Startups)
  • Over 95% of small business owners don’t have a basic understanding of how search engines work (Institute of Directors, 2016)

“Over 95% of small business owners don’t have a basic understanding of how search engines work”

Sources

  • https://www.ons.gov.uk/businessindustryandtrade/business/activitysizeandlocation/bulletins/businessdemography/2018
  • https://www.gov.uk/government/news/uk-company-statistics-2018-to-2019
  • https://www.gov.uk/government/statistics/business-population-estimates-2019
  • https://startups.co.uk/the-average-entrepreneur/
  • https://smeloans.co.uk/64-percent-of-britains-workforce-want-to-start-a-business/
  • https://www.thecompanywarehouse.co.uk/downloads/2016-uk-startup-funding-report.pdf
  • https://moneyzine.com/startup-resources/small-business-statistics/
  • https://www.business4beginners.co.uk/uk-small-business-statistics/
  • https://www.money.co.uk/business/business-statistics/small-business-statistics

Should I Advertise On Microsoft Ads?

Previously known as Bing Ads, Microsoft Ads is a self-serving online advertising platform that provides the closest alternative to Google Ads. Microsoft’s Bing holds the second biggest search engine market share in the UK, behind Google. 

Microsoft Ads lets you advertise on a network of search engines. This consists of three, all owned by Microsoft: Bing, Yahoo and DuckDuckGo (as well as a few other smaller ones). This is known as the Microsoft Search Network. 

Microsoft Ads doesn’t get quite as much attention as Google Ads. However, there are multiple benefits to using Microsoft Ads to digitally advertise your business. Let’s explore these further…

Who Uses The Microsoft Search Network?

How Much Traffic Do Microsoft Ads Get? 

Bing, Yahoo and DuckDuckGo (the search engines within the Microsoft Search Network) do get a huge amount of traffic:

  • 14.7 billion monthly desktop searches, globally 
  • 724 million worldwide desktop users 
  • Over 19 million PC users in the UK alone
  • 14.4% of the global PC market shares

Demographic

When advertising on Microsoft Ads, it’s important to know who uses the Microsoft search engines. 71% of Bing users are 35 or older. Here are some more stats on the Microsoft Search Network’s demographic within the UK: 

  • 42% of users are female and 58% are male
  • Around 50% of users are married
  • 61% of users have children living at home
  • 51% of users are university graduates 
  • 10% of users identify as LGBTQ+ 

Microsoft Ads Vs Google Ads

Microsoft Ads and Google Ads are very similar and the concept behind both is the same. These are both pay-per-click platforms to help reach a specific audience, increase revenue and drive traffic. But what are the main differences? 

Google Ads uses two advertising networks. These are the Search Network and the Display Network. When Advertising on Microsoft Ads, your ad will be shown on all search engines within the Microsoft Search Network. 

A big difference between the two platforms is the cost of a campaign. Bing PPC has a lot less competition for advertisers bidding. This causes clicks to be cheaper, allowing you to get more out of your budget. According to WordStream, the average CPC for Microsoft Ads is around £1.25. Google Ads can range from 48p (Display Network) to £1.95 (Search Network).

Other differences between the two platforms include: 

  • CTRs – Usually higher on Microsoft Ads, compared to Google Ads. 
  • Reach – Google Ads has a higher reach, compared to Microsoft Ads.
  • Remarketing Conversion Rates – Although Google Ads has a higher conversion rate overall, Microsoft remarketing ads often achieve a higher conversion rate, particularly for B2B decision-makers.  

Is It Worth Advertising On Microsoft Ads? 

If you are advertising on Google Ads, we would also recommend advertising on Microsoft Ads. According to Instapage, Microsoft Ads “reach 63 million searchers that aren’t reached with Google Ads”.

Microsoft has around 8% share of the UK search market in 2022. Advertising through the Microsoft Ads network is a great opportunity for businesses to reach more people alongside other ad platforms such as Google. 

Looking to get started on Microsoft Ads? Get in touch today.

Sources: 

  • https://optimyzd.co.uk/why-you-should-consider-microsoft-ads-in-2022/
  • https://instapage.com/blog/bing-ads-vs-google-ads
  • https://www.vertical-leap.uk/blog/how-much-do-google-ads-cost/
  • https://www.internetmarketingteam.co.uk/who-uses-bing-how-age-demographics-affect-how-someone-searches-on-the-internet/

26 Key ChatGPT Statistics & Facts 2023

In the rapidly evolving world of artificial intelligence, OpenAI’s language model, ChatGPT, stands as a testament to how far we’ve come. As we delve into the landscape of AI in 2023, it’s important to understand the specific contributions and progress of this dynamic technology. This article, titled “26 Key ChatGPT Statistics & Facts 2023“, will provide a comprehensive look at the latest data, revealing the full extent of ChatGPT’s capabilities, its limitations, and the diverse range of applications it supports. Join us as we explore this transformative technology, painting a vivid picture of how it’s reshaping the digital world and revolutionising human-computer interaction. There’s no need to be scared…yet.

ChatGPT User Growth and Reach Stats

  • ChatGPT successfully reached over 100 million users globally.
  • It accomplished this feat of gaining one million users within five days post-launch.
  • The United States is the leading country in terms of user base, contributing over 15% of the users.
  • An astounding user base growth and website traffic was achieved within a record span of three months from February to April 2023.
  • To put this growth into context, it took Instagram about 2.5 months and Netflix nearly 3.5 years to gain the first million users that ChatGPT managed in just five days.
  • As per a YouGov survey, between January 2023 and now, 17% of individuals aged 30 to 44 years and 15% of those aged 18 to 29 years have used ChatGPT.
  • Despite its global reach, ChatGPT access is restricted in several countries, including Russia, China, Iran, Ukraine, Venezuela, Belarus, and Afghanistan.

ChatGPT Website Traffic and Source Stats

  • The site, openai.com, enjoys around 1 billion monthly visits.
  • According to SimilarWeb, the site chat.openai.com receives approximately 1.8 billion visits over the past 30 days, with each visitor viewing about 6.22 pages per visit and spending around 8 minutes and 32 seconds on the website.
  • The majority of visits to ChatGPT, approximately 88%, are direct while social media contributes to about 4.61% of the traffic.
  • Of the social media traffic, YouTube is the leading source, driving around 57.01% of visits.

ChatGPT Model Details & Operational Stats

  • ChatGPT’s model comprises around 175 billion parameters and has been trained on approximately 300 billion words.
  • It handles an average of 10 million queries daily, with a daily operational cost estimated to be around $100,000.

ChatGPT Financial Forecasts & Investments Stats

  • Financial forecasts project that ChatGPT will earn $200 million by the end of this year and could reach up to $1 billion by the end of 2024.
  • Microsoft has shown confidence in ChatGPT’s capabilities with a substantial $1 billion investment.

ChatGPT Future Prospects:

  • The ChatGPT platform sets unprecedented records in user growth, paving the way for a promising future in the field of AI chatbots.
  • Enhanced comprehension: Future iterations could better understand nuanced queries and instructions.
  • Multimodal capability: Potential for integration with visual and auditory inputs.
  • Real-time interaction improvement: Increased processing power may allow faster responses.
  • Personalised experience: Advanced versions could learn from user interactions for tailored responses.
  • Greater integration: Possibility of wider integration with different software and hardware platforms.
  • Regulatory adherence: Emerging regulations and ethical guidelines could shape AI development.
  • Human-AI collaboration: Future versions could be more adept at assisting users with problem-solving.
  • Broadened language support: Possibility of supporting a wider variety of languages and dialects.
  • Industry-specific applications: Development of tailored versions for professional domains.
  • Bias and safety improvements: Continued research could lead to reductions in system biases and increase AI safety.

ChatGPT continues to redefine the capabilities of AI technology in 2023. Its consistent evolution, marked by impressive growth statistics, underlines the paradigm shift in how humans interact with AI. The usage statistics illustrate its worldwide acceptance and impact across various sectors. However, the figures also underscore the importance of constant advancements and ethical considerations in AI development. The application and learning abilities of ChatGPT make it a valuable tool, enabling profound changes in areas ranging from customer service to content creation, education, and beyond. As we look to the future, the statistics and facts about ChatGPT will undoubtedly continue to impress, as it remains at the forefront of AI innovation.

Sources

  • https://www.demandsage.com/chatgpt-statistics/
  • https://www.tooltester.com/en/blog/chatgpt-statistics/ 
  • https://explodingtopics.com/blog/chatgpt-users 
  • https://openai.com/