What Is UTM Tracking And How To Use It In Your Ads

Understanding the performance of your marketing campaigns is crucial for making informed decisions and optimising your advertising strategies. One of the best ways to measure your ads’ performance is by setting up UTM tracking parameters. UTM (Urchin Tracking Module) parameters are tags that you can add to your ad URLs, which allow you to track the source, medium, and campaign details of your traffic. In this blog post, we will guide you through the process of setting up UTM tracking for your ads step-by-step.

Step 1: Understand the UTM Parameters

Before you set up UTM tracking, it’s essential to familiarise yourself with the five primary UTM parameters:

  1. utm_source: This parameter identifies the source of your traffic, such as Google, Facebook, or LinkedIn.
  2. utm_medium: This parameter specifies the marketing medium, such as CPC (cost-per-click), email, or social.
  3. utm_campaign: This parameter defines the specific campaign you are running, like “summer_sale” or “product_launch.”
  4. utm_term (optional): This parameter is used to track keywords in paid search campaigns.
  5. utm_content (optional): This parameter is helpful for A/B testing and differentiating between multiple ad variations.

Step 2: Generate a UTM-Enabled URL

To create a UTM-enabled URL, you can either manually build it or use a UTM builder tool like Google Analytics Campaign URL Builder. Here’s an example of a UTM-enabled URL:

https://www.example.com/?utm_source=facebook&utm_medium=cpc&utm_campaign=summer_sale

If you’re using the Google Analytics Campaign URL Builder, follow these steps:

  1. Enter your website URL in the “Website URL” field.
  2. Fill in the required fields (Campaign Source, Campaign Medium, and Campaign Name).
  3. Optionally, fill in the Campaign Term and Campaign Content fields.
  4. Click “Generate URL” to create your UTM-enabled URL.

Step 3: Use the UTM-Enabled URL in Your Ads

Now that you have generated a UTM-enabled URL, use it as the destination URL for your ads. This will ensure that when users click on your ads, the UTM parameters are passed along, and their activity can be tracked.

Step 4: Analyse the Data in Your Analytics Platform

With your UTM tracking set up, the next step is to analyse the data in your analytics platform, such as Google Analytics. Here’s how to view UTM tracking data in Google Analytics:

  1. Log in to your Google Analytics account.
  2. Navigate to the “Acquisition” tab on the left-hand menu.
  3. Click on “All Traffic,” followed by “Source/Medium.”
  4. You will now see a report showing your traffic sources and mediums, with the associated metrics like sessions, bounce rate, and conversions.

Step 5: Optimise Your Campaigns Based on Insights

Using the data from your analytics platform, identify the best-performing sources, mediums, and campaigns. Optimise your ad spend, targeting, and creatives based on these insights to improve your overall marketing performance.

Setting up UTM tracking for your ads is a powerful way to gain insights into the performance of your marketing campaigns. By understanding the UTM parameters, generating UTM-enabled URLs, and analysing the data in your analytics platform, you can optimise your campaigns and improve your marketing ROI. Start implementing UTM tracking today to make data-driven decisions and achieve better results with your advertising efforts.

The Ultimate List of YouTube Statistics

*This blog post has been updated in 2023

Looking for the ultimate list of YouTube stats updated regularly with the freshest info?

You’ve come to the right place! test

When YouTube was launched way back in 2005, it was hard to imagine that the video sharing platform would soon get purchased by search engine giant, Google, and go on to be one of the most visited and valuable websites in the world.

Today, it’s hard to imagine life before YouTube: how on earth did we all learn DIY hacks, dance crazes or watch other people play video games we had no intention of buying?

If you’re as old as many of us, you’ll probably remember the excitement of visiting YouTube back in those early days and have been able to track it’s progression through to the present day.

With huge viewership comes advertisements, sponsorships and monetisation and it didn’t take long for YouTube to become a way for many content creators and advertisers alike to make a living from the engagement.

So if you’re a brand or marketer today, it’s hugely important that YouTube is part of of your advertising mix.

However, before you invest, it’s crucial to understand the full picture and hat’s why we’ve put together this ultimate list of eye-opening YouTube stats.

You may want to bookmark this list as it’s regularly updated and feel free to quote the stats on this page on your own site.

YouTube Viewership Stats

YouTube’s viewership has sky rocketed over recent years, but how many viewers does it have and many many minutes, hours and days of content are consumed?

  • In 2023, YouTube has 2.68 billion unique monthly visitors
  • 52% of worldwide internet users access YouTube once a month 
  • YouTube is the world’s second-most visited website
  • 694,000 hours of video are streamed on YouTube each minute
  • YouTube Shorts receive 30 billion daily views
  • In 2023, India has the most YouTube users
  • Baby Shark Dance” by Pinkfong Kids’ Songs & Stories is the most-watched video on YouTube. It has received over 7.91 billion views since 2016.

“In 2023, YouTube has 2.68 billion unique monthly visitors”

YouTube Mobile Stats

The internet has gone ‘mobile first’ since the birth of YouTube and the following stats support that fact:

  • Over 70% of YouTube watch time is generated from mobile devices
  • YouTube reaches more adults aged 18-49 during prime time on mobile alone than any cable network does per week
  • 75% of adults watch YouTube on their mobiles
  • Since 2017, over 50,000 years of product review videos have been viewed on mobile devices

“Over 70% of YouTube watch time is generated from mobile devices”

YouTube vs TV Stats

‘Is YouTube more popular than TV?’ has become a popular question in recent years… let’s take a look at the numbers:

  • Children and younger adults watch 1/3 less TV than they did back in 2010
  • YouTube reaches 120 million people watching on TV screens every month
  • As of 2019, YouTube’s advertising revenue was 9x what Google paid for it in 2006 and was also more than any major TV network generated in 2018
  • 6/10 users state they enjoy watching online video platforms rather than TV
  • YouTube’s 18-49 year old audience reach is 36% higher than that of TV

“YouTube reaches 120 million people watching on TV screens per month”

YouTube Advertising Stats

YouTube’s ad platform has the ability to target demographics that other mediums simply can’t… that’s why it’s so lucrative.

  • Youtube made $28 billion dollars in 2021 through ad revenue
  • YouTube ads have a potential reach over 2.5 billion users
  • Males aged 25-34 are YouTube’s biggest advertising audience
  • 70% of viewers say they’ve made a purchase after seeing a brand on YouTube
  • In 2022, the ad with the most views was for Amazon’s Alexa home speaker

“Youtube made $28 billion dollars in 2021 through ad revenue”


YouTube Growth Stats

YouTube is certainly not a new kid on the block anymore, but is it losing users to competition or does it continue to go from strength to strength?

  • There has been a 65%+ upturn in the number of channels with more than 1 million subscribers since 2020
  • There has been a 40% increase since 2020 in YouTubers who earn 6 figures or more
  • Content creators who earn 5 figures has increased 50+% since 2020
  • The top 10 YouTubers earned 30% more revenue in 2020 vs 2019
  • Only 700 YouTube channels have over 10 million subscribers

“There has been a 65%+ upturn in the number of channels with more than 1 million subscribers since 2020”


YouTube UK Stats

Having originated in the US, we know of YouTube’s popularity in the States… but how popular is it in the UK?

  • YouTube had over 50 million users from the UK alone in 2021.
  • 97% of UK based YouTube users logged in every month
  • 46% of all women in the UK used YouTube in 2021.
  • A 1/4 of all YouTube users from the UK were aged between 16 to 24 in 2021

“YouTube counted more than 50 million users from the UK alone in 2021.”

YouTube vs TikTok Stats

Video sharing site and YouTube competitor, TikTok, is the one of fastest growing sites in the world, but has it caught up to YouTube yet?

  • YouTube is still ahead of TikTok regarding the number of viewers and overall watch time
  • Everyday people watch a billion hours of video on YouTube
  • TikTok has over a billion monthly users whilst YouTube has more than 2 billion
  • As of 2021, TikTok users watched over 24 hours of content per month compared with 22 hours and 40 minutes on YouTube
  • TikTok overtook YouTube in May last year in the UK for content viewed per month
  • YouTube was the 4th most popular IOS app in 2020 after ZOOM, TikTok, and Disney+

“TikTok has over a billion monthly users whilst YouTube has more than 2 billion”


Sources

  • https://blog.hootsuite.com/youtube-stats-marketers/
  • https://www.thinkwithgoogle.com/marketing-strategies/video/online-video-live-tv-statistics/
  • https://join.marketing/blog/youtube/
  • https://www.cnbc.com/2021/03/10/youtubes-mohan-to-pitch-advertisers-on-connected-tv-boom.html
  • https://www.statista.com/chart/20714/youtube-ad-revenue/
  • https://promo.com/blog/tiktok-vs-youtube-which-should-you-choose-in-2022
  • https://cybercrew.uk/blog/youtube-usage-statistics-uk/
  • https://blog.hubspot.com/marketing/youtube-stats
  • https://www.theverge.com/2021/9/7/22660516/tiktok-average-watch-time-youtube-us-android-app-annie
  • https://www.demandsage.com/youtube-stats/#:~:text=As%20of%202023%2C%20YouTube%20has,at%20least%20once%20a%20month.
  • https://www.globalmediainsight.com/blog/youtube-users-statistics/
  • https://sproutsocial.com/insights/youtube-stats/

The Quick Guide To Merging Multiple Facebook Pages

Company Facebook pages are a great way to boost your brand awareness and interact with customers on a personal level. Ensuring that your brand is well represented on this social media platform should be a focus and users need to be given a reason to follow your brand. When doing this you may be managing multiple Facebook pages. However, this can be time consuming and difficult to do so.

How To Make Marketing Impact On A Budget

Are you still using an old marketing strategy and no longer seeing results from your campaigns? This could be a sign that your digital marketing strategy is in need of an overhaul.

Cargiant SEO Case Study – 3 Month Review

See how we achieved unprecedented keyword improvements after the first few months of an automotive SEO project for Cargiant.

How We Increased App Conversions By 2900% In Two Years

StudentCrowd is the UK’s biggest review website for students – they help students make the best decisions at university. Reviews by real students on courses, accommodation, finance help students make the right choices for them.

Is It Time To Change Your Marketing Strategy?

Are you still using an old marketing strategy and no longer seeing results from your campaigns? This could be a sign that your digital marketing strategy is in need of an overhaul.

The Impact of Social Media on Mental Health

Talking about mental health is no longer a taboo subject but not many people ever consider how certain aspects of social media might be having a negative effect on our mental health. We’ve looked into the ways it can affect us mentally and how to use social media to improve those days where getting out of bed can seem like a chore.

motorpoint case study ppc

Paid Media Case Study – Motorpoint

Motorpoint is one of the UK’s leading independent car supermarkets. They typically stock over 5,000 nearly new cars, spanning over 30 trusted manufacturers. Motorpoint has fantastic coverage across the UK, championing 13 dealerships from Glasgow to Chingford.

When we partnered up with their marketing team, we reviewed the account and worked together to determine what improvements and opportunities were available to move the account forward.


Objectives

> Reduce brand search spend

> Reduce CPC

> Improve tracking

> Increase footfall

> Improve location targeting

> Localised branch strategies

> Be more stock focused

At the start of 2019, Motorpoint came to Limelight with various objectives to improve their paid media activity. 

One of the main issues that we noticed with the account was that a large percentage of the campaigns were targeting a UK wide audience. This was causing inconsistency with spend allocation and some dealership locations were either getting too much or too little of a share of the overall budget. This also meant that there was money being spent in areas located far away from any dealership. Our work started by reducing all national activity and creating a set of campaigns for every branch and allocating a more even split of the budget.


Brand Search 

After analysing the position of Motorpoint’s brand search, we identified a few areas for concern in which we found some opportunities to improve the campaign performance:

  • Budgets were too high.
  • Campaigns were missing ad extensions.
  • Ad copy relevance was poor.
  • Location targeting needed to be refocused.
  • Manual bidding to be switched to automated bidding.


Results: (2018 Vs. 2019)

> Spend dropped by 79% YoY

> CPC dropped 86% YoY

> Clicks were down 6%

> Cost per Store Visits dropped by 81% YoY

> Cost per Phone Call dropped by 73% YoY 

> Cost per Enquiry Form dropped by 90% YoY


Generic Search

We swapped out the national approach to become more tactical with our strategy by localisation and narrowing our focus into the areas surrounding the dealerships. The account became pretty complex after this, multiplying our campaign count by thirteen. However, this allowed us to improve the Paid Search process in the following ways:

> Greater control over dealership budgets

> Increased inventory focus efficiencies

> Branch level strategies

> Branch level reporting

> Branch level footfall data


Expanded Text Ads

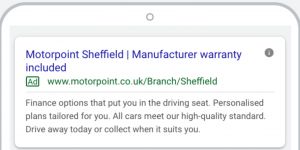
This is the standard Ad format recommended for Search. It utilises 3 x Headlines and 2 x  Descriptions. Google recommends 2 x variations of this Ad Type to be included in every Ad Group.


Responsive Search Ads

Google recommends having at least one Responsive Search Ad in every ad group. We’ve worked hard to ensure we have these live across the account. You can add up to 15 headlines and 4 descriptions. The Ad will automatically show different combinations and optimize to show what works the best.


Gallery Ads 

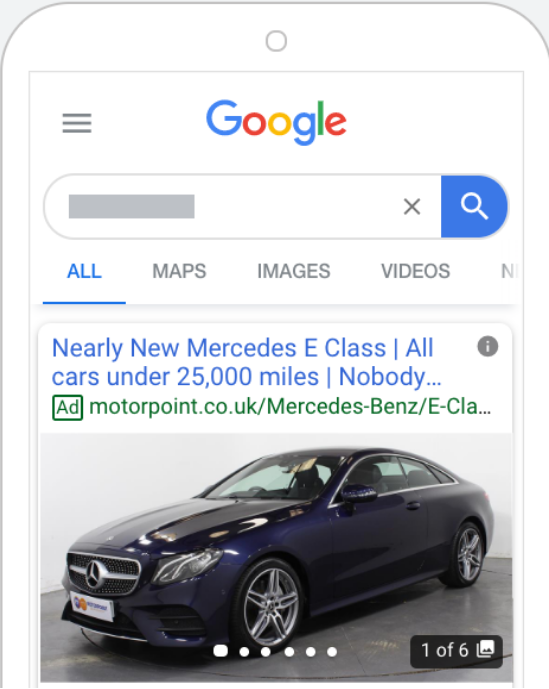
We were lucky enough to be granted early access to this new Ad Type. The Gallery Ad allows up to 6 images and slots in below a normal text ad. We’ve seen some really strong Click-Through-Rate & low Cost-Per-Clicks from these ads.


Results: (2018 Vs 2019)

  • CPC increased by 22% YoY
  • Store Visits increased  by 32% YoY
  • Calls were up by 9% YoY
  • Contact form enquiries up 204% YoY


Display & Remarketing

After reviewing the Display activity that was in place, we identified the following areas of opportunity in order to improve the account:

  • New remarketing lists to be created and applied to campaigns.
  • Utilise Google’s Automotive In Market Audience lists and apply to campaigns.
  • Smart campaigns to be rolled out.
  • Location targeting to be refocused.
  • Improvement on banners, messaging & localisation.
  • Manual bidding to be changed over to automated bidding.


Results: (2018 Vs. 2019)

> Spend was reduced by 18% YoY

> CPC dropped by 53% YoY

> Impressions increased by 10% YoY

> Google Ads clicks increased 74% YoY


Store Visits 

Motorpoint is fortunate enough to have the availability of Store Visit data. For companies that have physical stores and are registered on Google My Business, if you link GMB with Google Ads so that we have visibility of what Campaigns, Ad Groups & Keywords are driving footfall. Once an ad is clicked, Google Ads then uses GPS to track a user and report if they visit a dealership. 

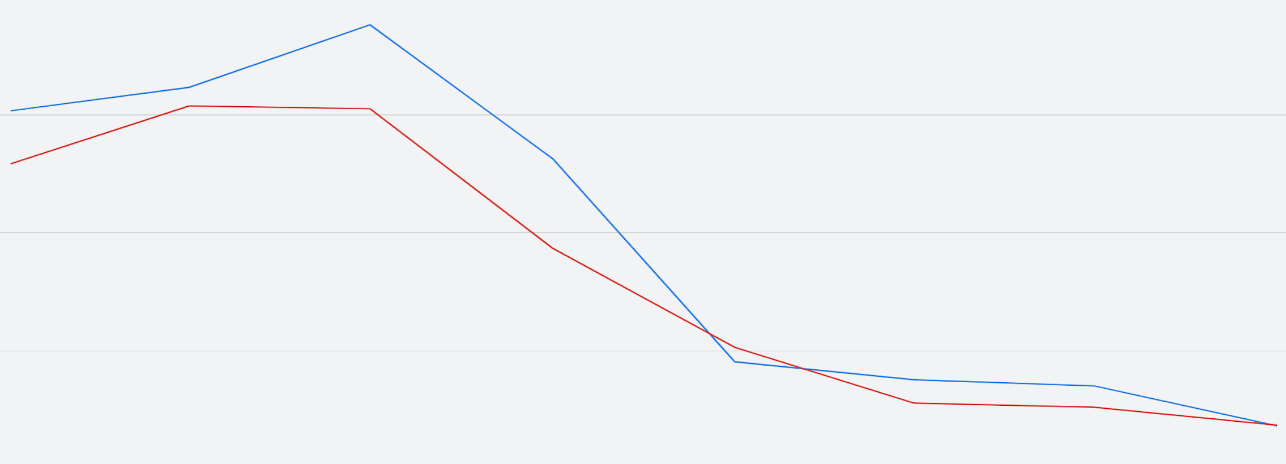
The national targeting structure that was being utilised when we took on the account made it difficult to see which branches were getting the Store Visits. By splitting the structure into a set of campaigns for each individual branch, it became clearer to see the Store Visit data at branch level. By doing this, it also allowed us to refocus the targeting to areas within a certain distance of each dealership, which boosted Footfall performance. We saw significant YoY increases from March to September:


Inventory Focus 

With the nature of Motorpoint’s business, it’s quite important for the paid media to adapt and align with the inventory. Motorpoint sells cars from over 30 manufactures. This means that they often have over 200 models in stock at a given time. We’ve worked to put a system in place that allocates more budget to the models highest in stock in order to optimize our spend accordingly.


YouTube

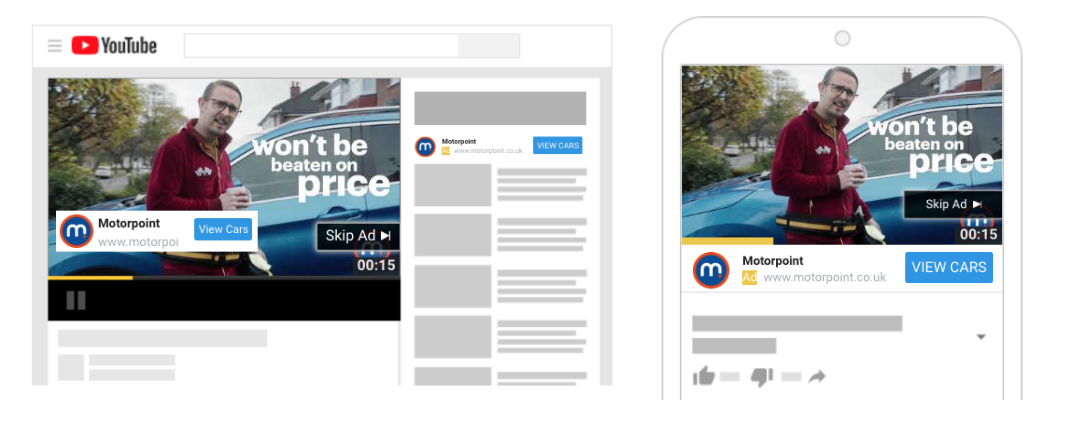
From the off, we wanted to introduce a stronger, more comprehensive strategy for Motorpoint’s YouTube awareness activity. When we took on the account, they just had one national campaign in play. In the same way that we changed the Search activity, we split this out at branch level and localised the creatives. On the back of this, we saw a huge improvement on the influence YouTube had on Store Visits:

  • Spend increased by 485% YoY
  • Cost per view increased by 9% YoY
  • YouTube Store Visits increased by 4,617% YoY


Smart & Local Campaigns 

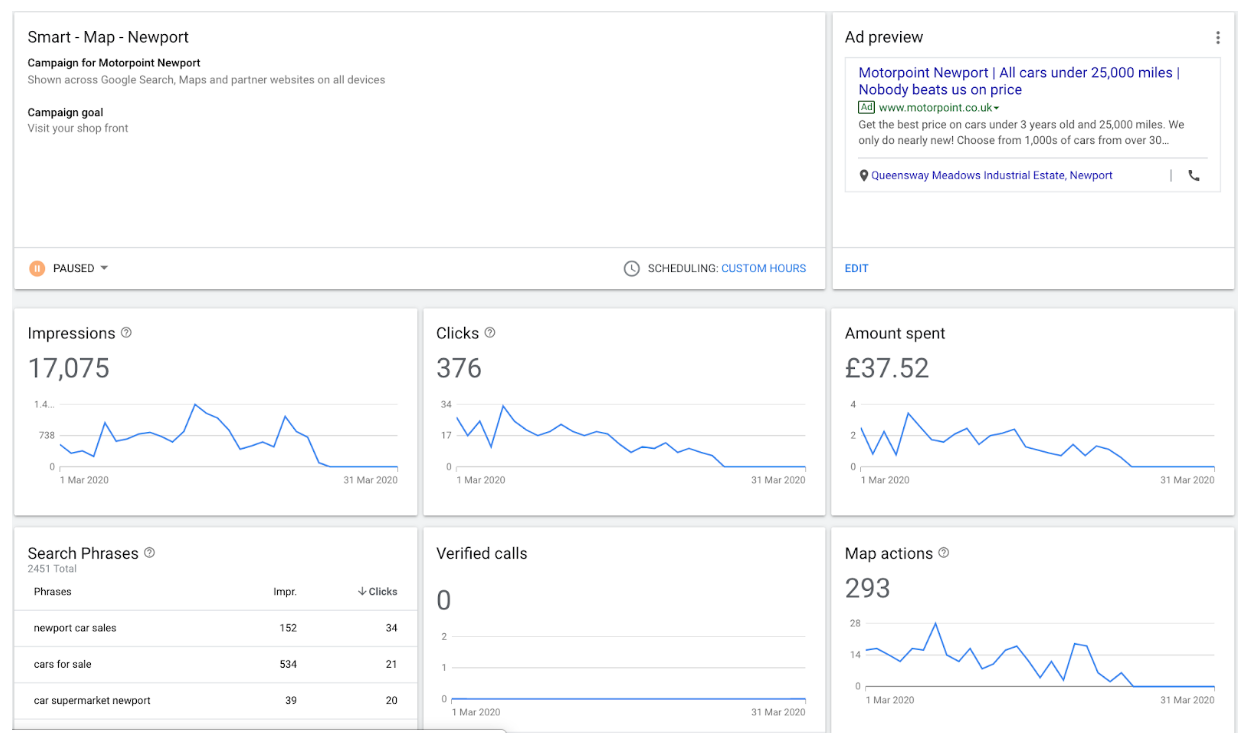
We were fortunate enough to be granted early access by Google to some new campaign types whilst they were still in beta. It would seem Google is steering businesses towards more automated activity. We’ve implemented these campaign types for Motorpoint and have seen some great results off the back of this.


Local Campaigns

Local campaigns are designed to use Google advertising to bring business to your shop front. Local campaigns streamline the process for you, making it easy to promote your shops across Google’s largest properties including the Google Search Network, Maps, YouTube and the Google Display Network. Just add a few lines of text, a bid, some assets and the rest is optimised to help your users find you.” – Google Ads


Google Ads Smart Campaigns

When you sign up for a Smart campaign, you’ll write an ad that describes your business. You’ll also describe your business’s product or service and set a budget. Your ad will automatically show to potential customers across Google Search, Google search partners, Google Maps and the Google Display Network.

Your Smart ad can appear when potential customers in your targeted geographic area search for phrases related to your business on Google or Google Maps. Your ad can also appear for people who are outside of your area, but who include terms related to your business as well as your business location in their searches.” – Google Ads


With new competitors coming into the market, offering services like online car buying and home delivery, it’s a challenging, yet exciting time for the Automotive industry.

For more information on how we can help you with Paid Search Advertising or any other form of Digital Marketing please get in touch, or whilst you’re here, why not read more of our Case Studies

The Rise and Fall of Houseparty

Over the years, technology has grown leaps and bounds. It’s never been easier to connect with your friends and families during this uncertainty. Skype and Facetime are still popular, however social media is still growing providing new apps specifically designed for video chatting. Leading the way is ‘Houseparty’, a social media platform to connect anyone to their friends.

What is Houseparty?

Unlike its rivals, Houseparty has taken video chatting to a whole new level. Allowing users to simultaneously chat to up to 8 separate friends. Although this might sound chaotic, the app offers a party-like feel by using a split-screen feature, it divides the party into separate real-time boxes. 

When released the app promised excellent security features and allows you to choose who you want to talk to, accepting friend requests and user details. Ideal for their target market of teenagers whilst offering reassurance for parents. 

The Success of Houseparty

Whilst the whole world is on lockdown communicating digitally has never been more popular. Teenagers can no longer go out and meet their friends so they are finding their way to communicate with their friends using the technology in their hands. 

With the advantage of receiving notifications when your friends are online and available to talk. You can choose to enter the conversation when you want or stay out of it completely. It also allows users to play games with their friends enabling them to have more interaction than other online video chat software. 

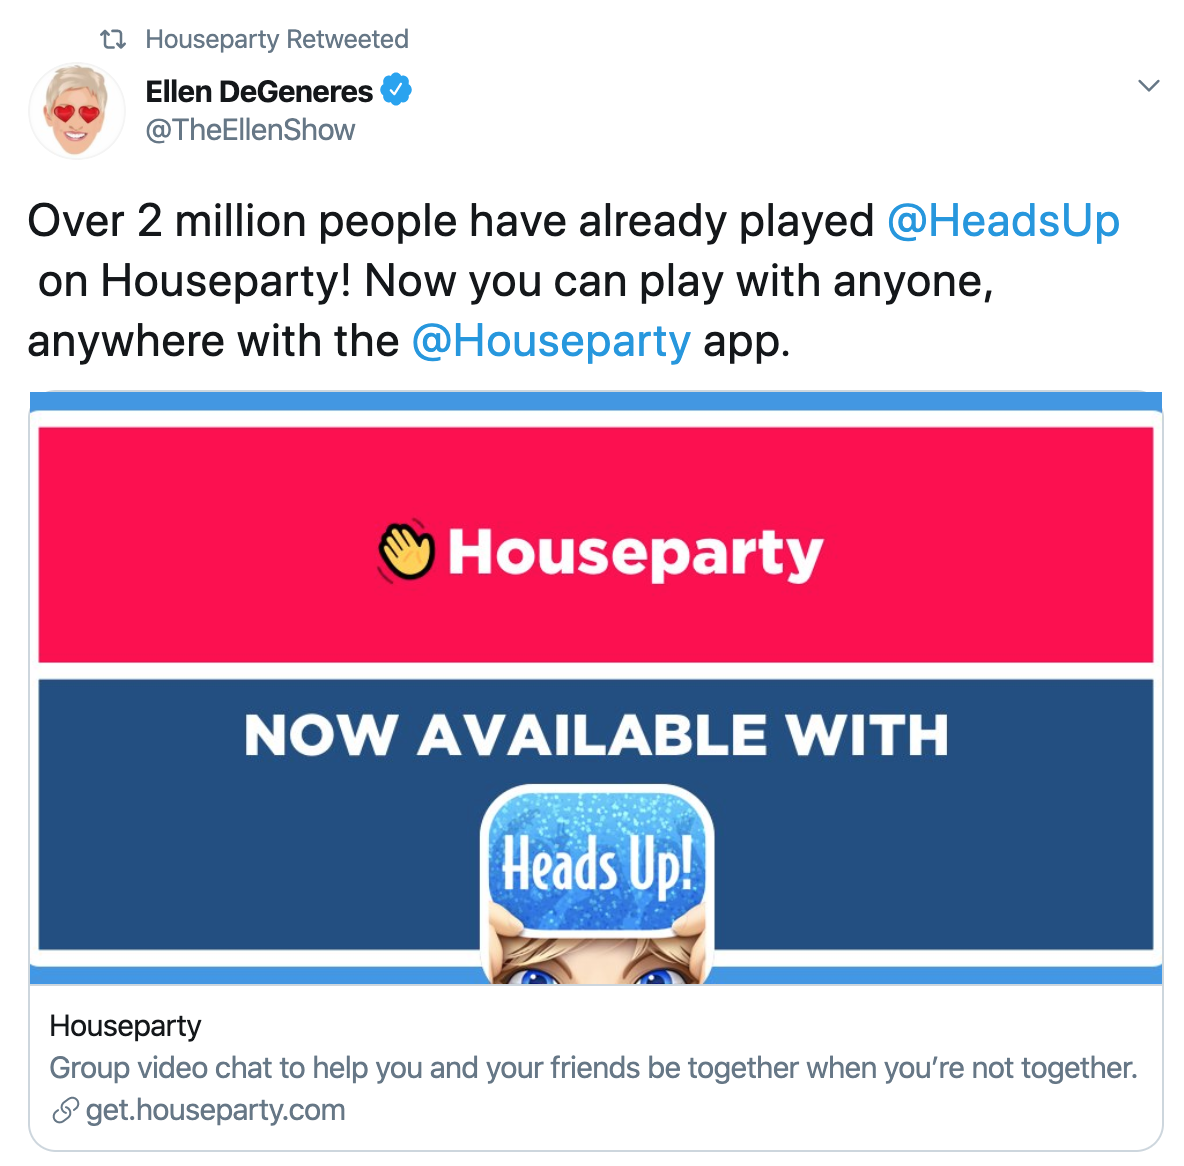
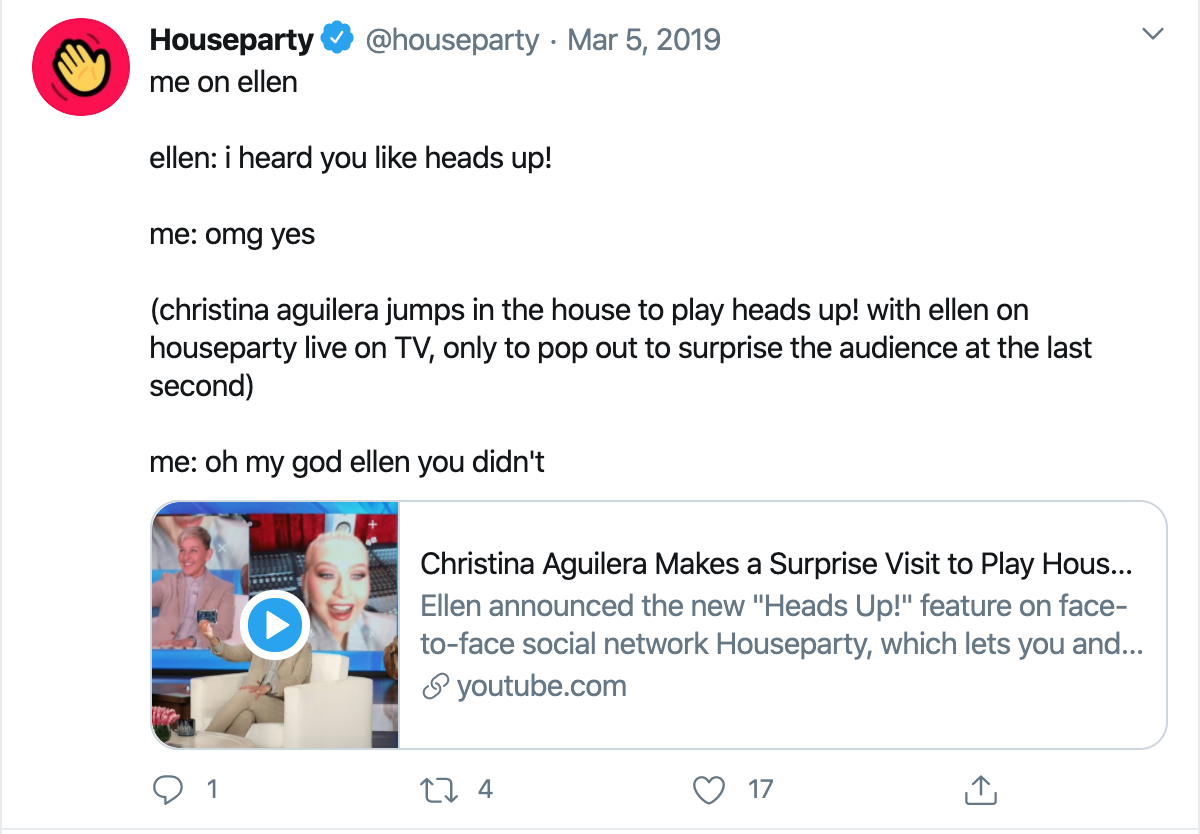
With branded endorsements from Ellen DeGeneres and partnerships with mobile game Head’s Up, Houseparty has grown in success since it’s launch in 2019. 

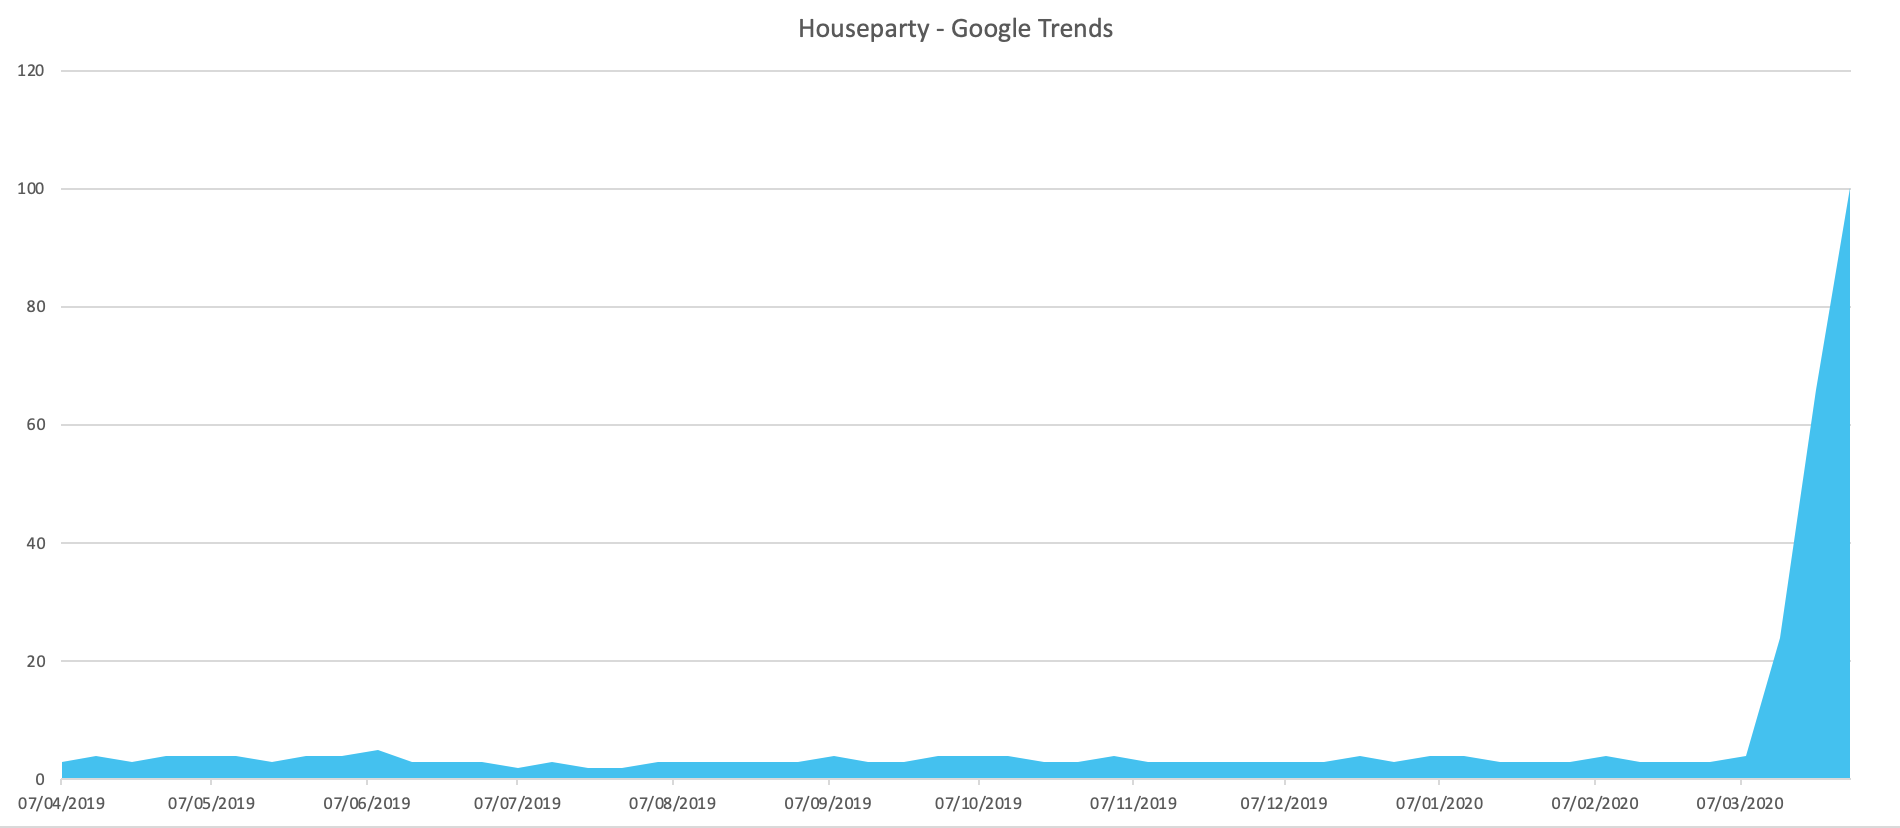
Covid-19 has increased the number of downloads as countries around the world have placed their residents into lockdown so this has become a popular way of people connecting with each other. Google saw a spike around searches at the beginning of March when lockdowns started to take effect.

What Went Wrong?

With millions of users worldwide, keeping users’ identities and credentials safe should have been a high priority but only recently the app has come under scrutiny and rumours of a potential hack. The app has become a viral hit since countries have put residents on a lockdown which includes social distancing and self-isolation, but just recently terrified users are deleting their profiles and the app itself since receiving word of a potential intrusion. 

Large numbers of Twitter users are reporting that they’ve had their Spotify, PayPal and bank accounts hacked into since downloading the app.

Epic Games, who created Houseparty, have recently issued a $1 million (£766,000) bounty for the first person who can provide proof of the hack. Epic Games produce many well-known games including Borderlands, Red Dead Redemption and Assassin’s Creed so this is unwanted publicity for them.

Did They Get Hacked?

Although Houseparty users are claiming the hack is real there could be many different reasons which have no connection with the app. 

Cybercrime is on the rise especially as hackers are preying on confusion and interest in the coronavirus crisis. It could be possible that the Houseparty users have simply been caught out by another scam. 

Social media may also play a role in the mass hysteria here as well.

Many users are stating that friends of friends have been hacked which is usually a telltale sign of a hoax. This also helps the topic trend on Twitter which grabs more attention and eventually grabs the attention of the designers. The more people talk the more realistic the hack looks.

So should you delete the app?

Some users are now rushing to delete the app but it could be something as simple as changing to a stronger password and making sure you haven’t used the email you registered in connection with your other accounts. 

It’s important to remember that there has been a rise in the number of cybercrime activities directly linked to the increased traffic on social media platforms now that everyone is currently in isolation. 

It’s always important to stay safe online no matter what app you’re using. If you think one of your apps is in danger of being hacked then it might be time to change your password.