As of 2025, there are over 150 million startups worldwide, with approximately 50 million new ones launching each year.
In the UK alone, by the end of 2024, there were 5.63 million active companies.
In 2024 alone, 5.2 million new businesses were started, mostly in fintech, AI, and enterprise technology.
Around 90% of startups still fail.
In this report, I’ll walk you through the latest numbers, who’s starting these businesses, why so many don’t make it, and what trends are shaping the startup world in 2025.
Disclaimer: The numbers in this article are valid until July 2025 and are subject to change over time.
Startup Statistics: Highlights (2025)
- As of 2025, there are over 150 million startups globally, with approximately 50 million new startups being launched annually. Source: Creatly
- The U.S. leads with the most number of startups (84,624), followed by India (17,843) and the U.K. (7,742). Source: Startup Ranking
- 90% of startups fail, with 42% failing due to a lack of market need and 29% running out of cash. Source: Startups
- Women now make up 41.5% of U.S. entrepreneurs, but all-female teams get only 1% of VC funding. Source: Zippia
- There are 1,489 active unicorns globally (as of 2025), valued at $5 trillion, with 1047 in the U.S. alone. Source: Pitchbook2
- Only 40% of startups are profitable, while 33% break even and 33% operate at a loss. Source: Small Biz Trends
- Startup costs average $460,000–$485,000 in the first year for a 5-person team, with payroll as the top expense. Source: BankRate
How Many Startups Are There?
- There are over 150 million startups worldwide, with approximately 50 million new startups launched each year. Source: Creatly
- In 2024, there were approximately 34.8 million businesses in the U.S. Source: Advocacy
- 5.2 million new business applications were filed in the U.S in 2024. Source: US Census
- There were 5.63 million active companies in the UK by the end of 2024. Source: NatWest
- 89,515 new businesses were formed in the UK in Q1 2025. This was 36.49% more than Q1 2024 (65580). Source: Business Demography
| Year | 2017 | 2018 | 2019 | 2020 | 2021 | 2022 | 2023 | 2024 | 2025 |
|---|---|---|---|---|---|---|---|---|---|
| Q1 | 97,340 | 88,295 | 97,105 | 89,910 | 1,01,845 | 1,01,410 | 80,860 | 87,085 | 89,515 |
| Q2 | 80,930 | 95,715 | 95,675 | 73,415 | 91,400 | 87,685 | 76,460 | 81,815 | – |
| Q3 | 86,385 | 79,410 | 84,970 | 76,585 | 81,160 | 68,460 | 78,325 | 75,555 | – |
| Q4 | 73,975 | 76,725 | 77,970 | 82,080 | 79,870 | 69,955 | 71,500 | 65,580 | – |
Source: Business Demography
| Year | 2017 | 2018 | 2019 | 2020 | 2021 | 2022 | 2023 | 2024 | 2025 |
|---|---|---|---|---|---|---|---|---|---|
| Q1 | 904,358 | 1,003,592 | 1,002,015 | 968,019 | 1,574,599 | 1,461,222 | 1,523,480 | 1,507,024 | 1,435,171 |
| Q2 | 825,780 | 916,517 | 913,285 | 936,826 | 1,512,329 | 1,328,319 | 1,425,339 | 1,349,619 | 1,008,921 |
| Q3 | 752,698 | 827,754 | 815,304 | 1,483,495 | 1,225,134 | 1,199,963 | 1,343,745 | 1,214,508 | N/A |
| Q4 | 699,060 | 739,308 | 768,229 | 967,853 | 1,077,644 | 1,070,176 | 1,168,907 | 1,130,496 | N/A |
Source: US Census
| Year | New Startups (U.S.) | Total Small Businesses (U.S.) |
|---|---|---|
| 2024 | 5.2 million | 34.8 million |
Startup Demographics
- The average age of a successful founder is 45 years. Source: HBR
- In 2023, 86.8% of startup founders were men, while women made up only 13.2% of global startup founders. Source: Carta
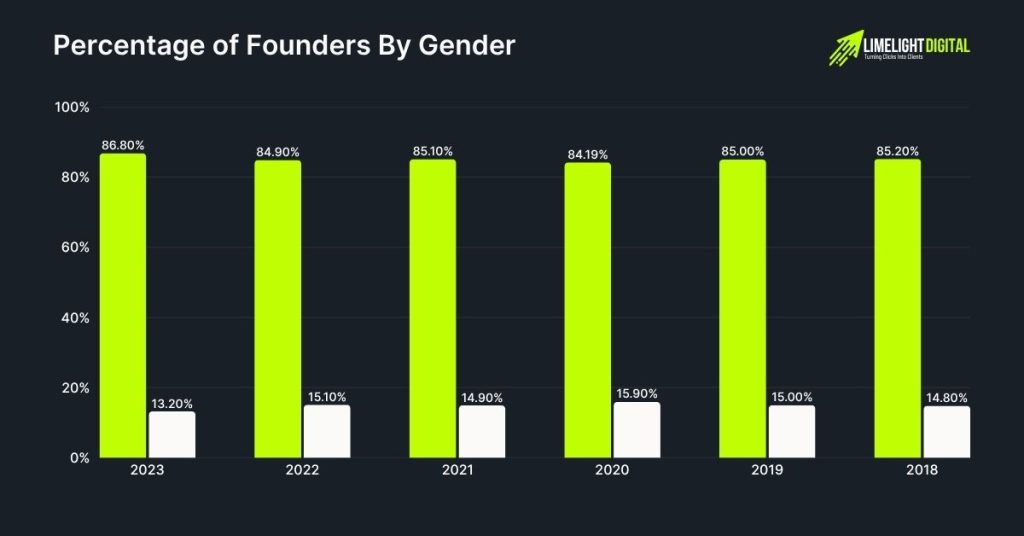
| Sr. No. | Year | Men | Woman |
|---|---|---|---|
| 1 | 2023 | 86.80% | 13.20% |
| 2 | 2022 | 84.90% | 15.10% |
| 3 | 2021 | 85.10% | 14.90% |
| 4 | 2020 | 84.19% | 15.90% |
| 5 | 2019 | 85.00% | 15.00% |
| 6 | 2018 | 85.20% | 14.80% |
Source: Carta
Startup Founders by Age
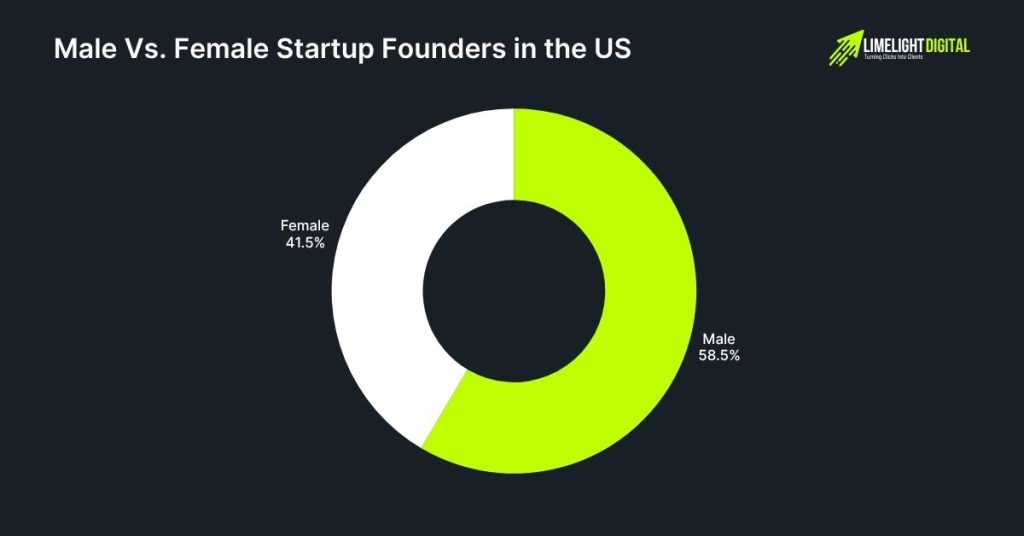
- 58.5% of startup founders in the US are male, while female founders account for 41.5%.
| Sr. No. | Founder | % Split |
|---|---|---|
| 1 | Male | 58.5% |
| 2 | Female | 41.5% |
Source: Zippia
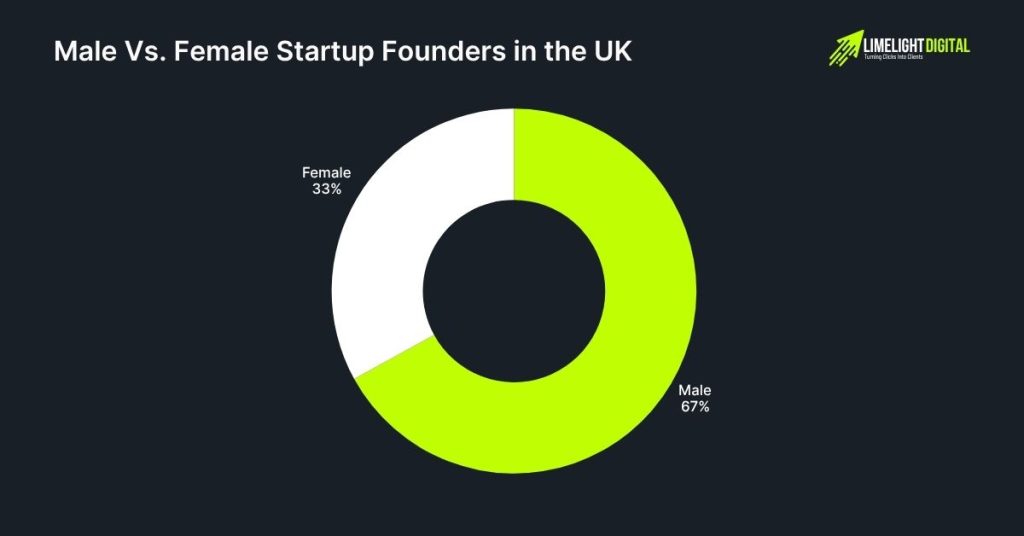
- In the UK, 67% of startup founders are male, whereas only 33% are female.
| Sr. No. | Founder | % Split |
|---|---|---|
| 1 | Male | 67% |
| 2 | Female | 33% |
Source: London Edu
- All-female-founded companies (with no male co-founders) received only 1% of total VC funding in 2024 (approx. $1.94 billion). Source: London Edu
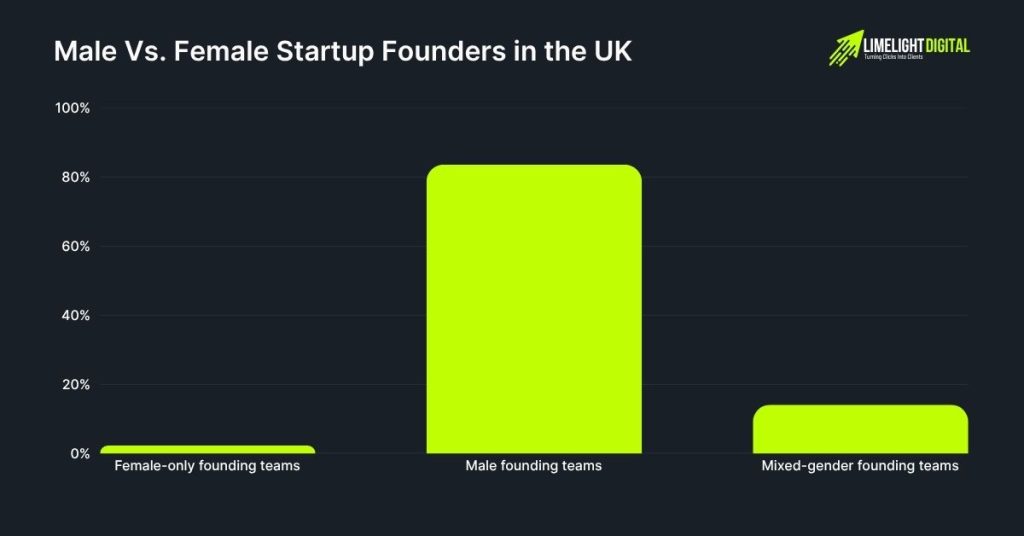
- Out of the total global venture capital funding, female-only founding teams received 2.3%, amounting to $6.7 billion.
- In contrast, all-male founding teams secured 83.6%, or $241.9 billion.
- Meanwhile, mixed-gender founding teams attracted 14.1% of the funding, totaling $40.7 billion. Source: Founders Forum
| Sr. No. | Founding Team Gender | Venture Capital Received | % Venture Capital Received |
|---|---|---|---|
| 1 | Female-only founding teams | $6.7 billion | 2.3% |
| 2 | Male founding teams | $241.9 billion | 83.6% |
| 3 | Mixed-gender founding teams | $40.7 billion | 14.1% |
Source: Founders Forum
Countries With The Most Number Of Startups
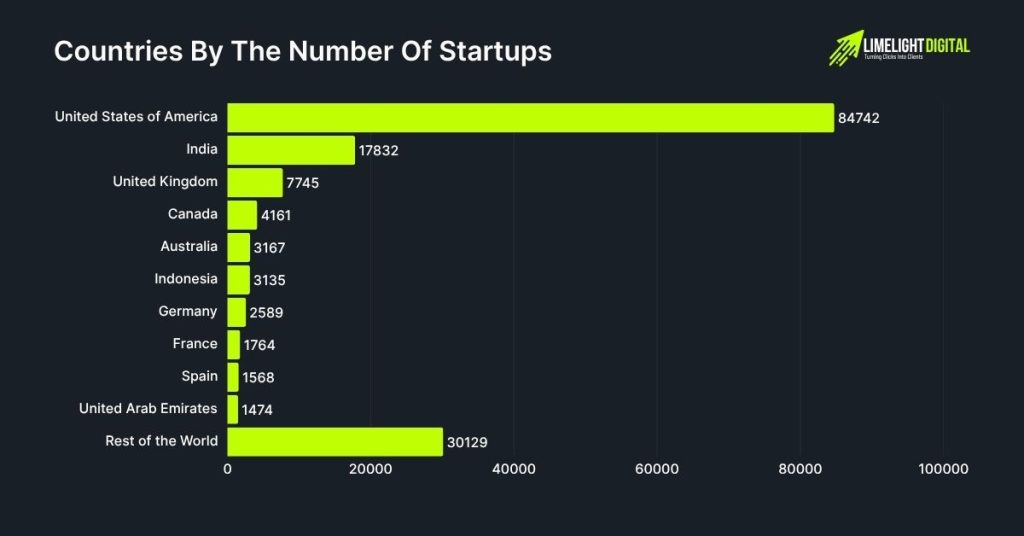
- As of 2025, the United States has the largest number of startups (84,624).
- Currently, it houses more startups than the combined startups from the rest of the countries, as shown below.
| Sr. No. | Countries | No. of Startups |
|---|---|---|
| 1 | United States of America | 84,742 |
| 2 | India | 17,832 |
| 3 | United Kingdom | 7,745 |
| 4 | Canada | 4,161 |
| 5 | Australia | 3,167 |
| 6 | Indonesia | 3,135 |
| 7 | Germany | 2,589 |
| 8 | France | 1,764 |
| 9 | Spain | 1,568 |
| 10 | United Arab Emirates | 1,474 |
| 11 | Rest of the World | 30,129 |
Source: Startup Ranking
Global Unicorn Statistics
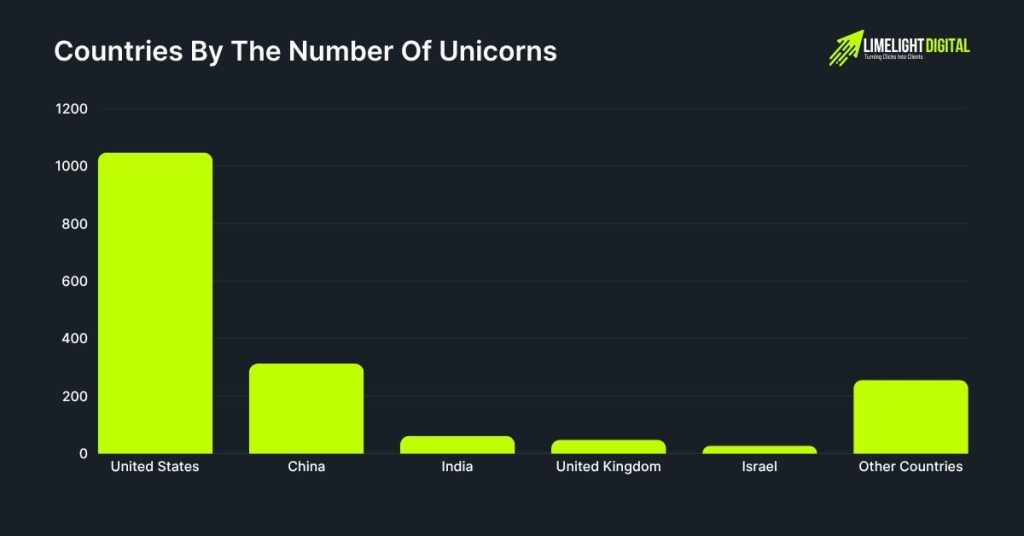
- As of 2025, there are approximately 1,489 active unicorns with a cumulative valuation of $5 trillion and have raised a total of $959.8 billion in venture capital. Source: Pitchbook2
- The US has the most unicorns (1047), followed by China (313) & India (61).
| Sr. No. | Country | Number of Unicorns | Global Share (%) |
|---|---|---|---|
| 1 | United States | 1047 | 50.80% |
| 2 | China | 313 | 21.80% |
| 3 | India | 61 | 4.30% |
| 4 | United Kingdom | 48 | 3.30% |
| 5 | Israel | 27 | 1.90% |
| 6 | Other Countries | 256 | 17.80% |
| 7 | Total | 1,434 | 100% |
Source: PitchBook, Pitchbook2
- The U.S. is the mecca for fintech startups, with 10,755 as of 2021.
| Sr. No. | Region | Active Unicorns (2022) | Notable Fact |
|---|---|---|---|
| 1 | U.S. | 1,047 | $1.1T total value of unicorns |
| 2 | Global | ~12,000 fintech startups | U.S. leads in fintech startup count (10,755 as of 2021) |
Source: CFTE
Which Is The Most Successful Startup?
- As of 2025, SpaceX stands as the most successful startup, with a valuation of $350 billion.
The table below highlights the world’s top 10 highest-valued startups across different industries and countries.
| Sr. No. | Company | Valuation ($B) | Date Joined | Country | Industry |
|---|---|---|---|---|---|
| 1 | SpaceX | $350 | 12/1/2012 | United States | Industrials |
| 2 | ByteDance | $300 | 4/7/2017 | China | Media & Entertainment |
| 3 | OpenAI | $300 | 7/22/2019 | United States | Enterprise Tech |
| 4 | Stripe | $70 | 1/23/2014 | United States | Financial Services |
| 5 | SHEIN | $66 | 7/3/2018 | Singapore | Consumer & Retail |
| 6 | Databricks | $62 | 2/5/2019 | United States | Enterprise Tech |
| 7 | Anthropic | $61.5 | 2/3/2023 | United States | Enterprise Tech |
| 8 | xAI | $50 | 5/26/2024 | United States | Enterprise Tech |
| 9 | Revolut | $45 | 4/26/2018 | United Kingdom | Financial Services |
| 10 | Canva | $32 | 1/8/2018 | Australia | Enterprise Tech |
Source: CBInsights
What Percentage Of Startups Fail?
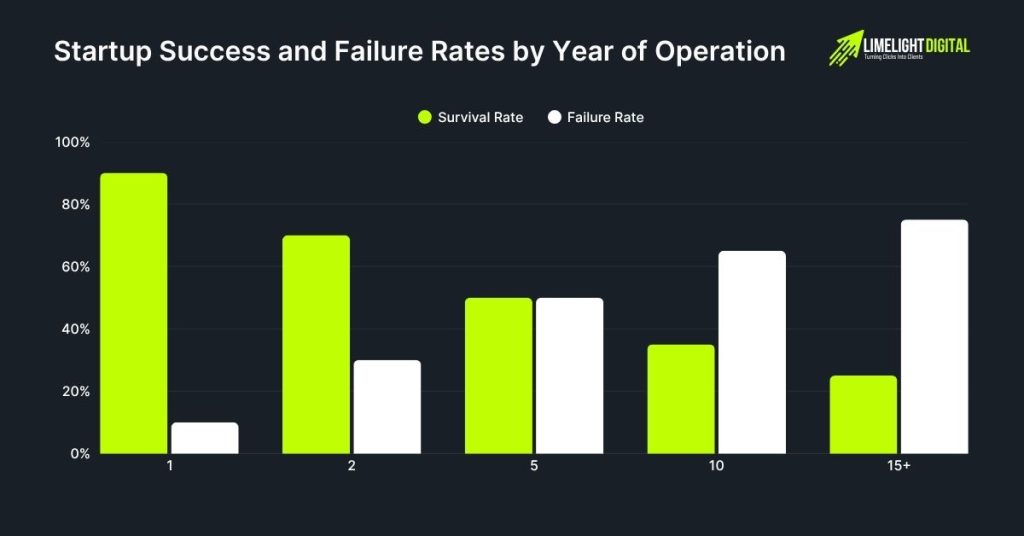
- About 90% of startups fail.
- Approximately 10% of startups fail within the first year.
- 70% of startup failures occur between years two and five.
| Sr. No. | Year of Operation | Survival Rate | Failure Rate |
|---|---|---|---|
| 1 | 1 | 90% | 10% |
| 2 | 2 | 70% | 30% |
| 3 | 5 | 50% | 50% |
| 4 | 10 | 35% | 65% |
| 5 | 15+ | 25% | 75% |
Source: ClearPayments
Top Reasons Startups Fail
- 42% fail due to misreading market demand.
- 29% run out of funding.
- 23% fail due to weak founding teams.
- 19% are outcompeted.
Source: Startups
| Sr. No. | Reasons | % of Total Failed Startups |
|---|---|---|
| 1 | Lack of Market Demand | 42% |
| 2 | Ran Out of Funds | 29% |
| 3 | Team Lacked the Right Skills or Chemistry | 23% |
| 4 | Outpaced by Competitors | 19% |
| 5 | Unsustainable Pricing or Cost Structure | 18% |
| 6 | Weak or Flawed Product | 17% |
| 7 | Unclear or Broken Business Model | 17% |
| 8 | Ineffective Marketing Strategy | 14% |
| 9 | Neglected Customer Feedback | 14% |
| 10 | Launched Too Early or Too Late | 13% |
| 11 | Lost Strategic Focus | 13% |
| 12 | Internal Conflict Among Team or Investors | 13% |
| 13 | Pivoted in the Wrong Direction | 10% |
| 14 | Lacked Founder Passion or Commitment | 9% |
| 15 | Poor Choice of Location or Market | 9% |
| 16 | Unable to Secure Funding or Investor Interest | 8% |
| 17 | Legal or Regulatory Problems | 8% |
| 18 | Failed to Leverage Mentors or Networks | 8% |
| 19 | Founder or Team Burnout | 8% |
| 20 | Resisted Necessary Business Pivot | 7% |
Startup Profitability And Financial Health
- Only 2 in 5 startups are profitable.
- 1 in 3 startups break even; 1 in 3 continue to lose money. Source: Small Biz Trends
- 82% of failed startups cite cash flow problems as the primary reason for their failure. Source: Fundera
| Sr. No. | Profitability Status | Percentage |
|---|---|---|
| 1 | Profitable | 40% |
| 2 | Break-even | 33% |
| 3 | Losing money | 33% |
Startup Ecosystem And Global Trends
- Venture capital funding reached $368.3 billion in 2024. Source: KPMG
- Only 1% of startups become unicorns. Source: Bain
- As of 2025, there are 1047 active unicorns in the U.S. Source: Pitchbook2
| Sr. No. | Year | Global VC Funding | U.S. Unicorns | Global Unicorns (Estimate) |
|---|---|---|---|---|
| 1 | 2024 | $959.4B | 1047 | 1489 |
Source: Pitchbook2
Startup Costs And Operations
- The average cost for a five-person startup in its first year is $460,000 to $485,000.
- Equipment costs can range from $10,000 to $125,000. Source: BankRate
- 31% of startup capital for employer firms is less than $10,000. Source: Federal Reserve
| Sr. No. | Expense Type | Typical Cost |
|---|---|---|
| 1 | First-year payroll (5 staff) | $460,000 to $485,000 |
| 2 | Equipment | $10,000–$125,000 |
| 3 | Startup capital (31% firms) | <$10,000 |
Startup Lesser-Known Facts & Insights
- Founders with prior success have a 30% chance of succeeding in their next venture.
- First-time founders have an 18% chance of success, while those who failed previously have a 20% chance of success. Source: SSRN Paper
- Two founders increase the odds of success by 30% more investment and three times the customer growth rate. Source: LinkedIn
- The primary challenge for startups is achieving product-market fit.
Click For More Stats:
10-Year Historical Trends (2015–2025)
- The startup failure rate has remained steady at around 90%.
- Funding amounts and new business formations have increased steadily over the last decade.
Here’s a 10-year breakdown of the Startup ecosystem
| Sr. No. | Year | Startup Failure Rate | Avg. Series A Funding | UK New Startups | U.S. New Startups |
|---|---|---|---|---|---|
| 1 | 2015 | 90% | $12.1M | 608K | 4.4M |
| 2 | 2020 | 90% | $14.5M | 726K | 4.7M |
| 3 | 2022 | 90% | $15M | 846K | 5.0M |
| 4 | 2025 | 90% (est.) | $15M (est.) | 89K (Q1) | 5.2M (est.) |


